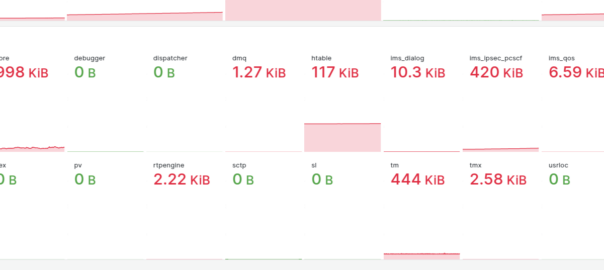
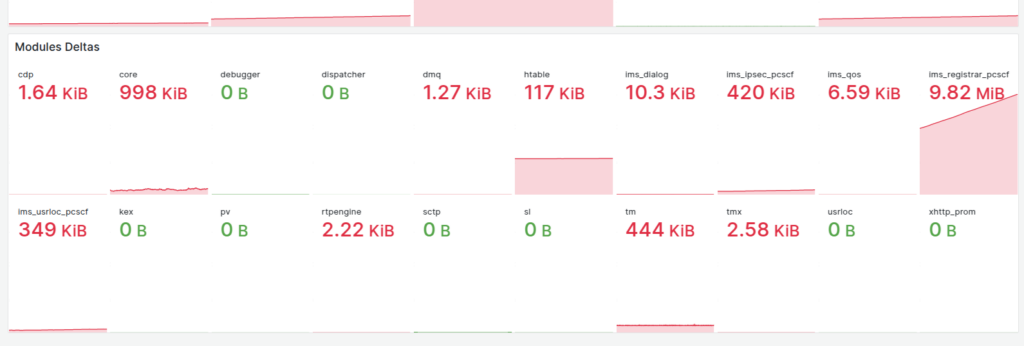
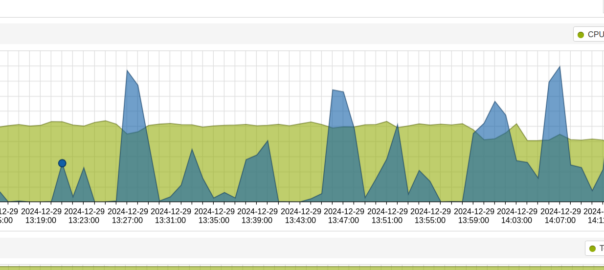
Our dashboards showed this slow memory leak, with the memory slowly ticking up on a certain group of machines, we knew there was a memory leak, but in which Kamailio module?
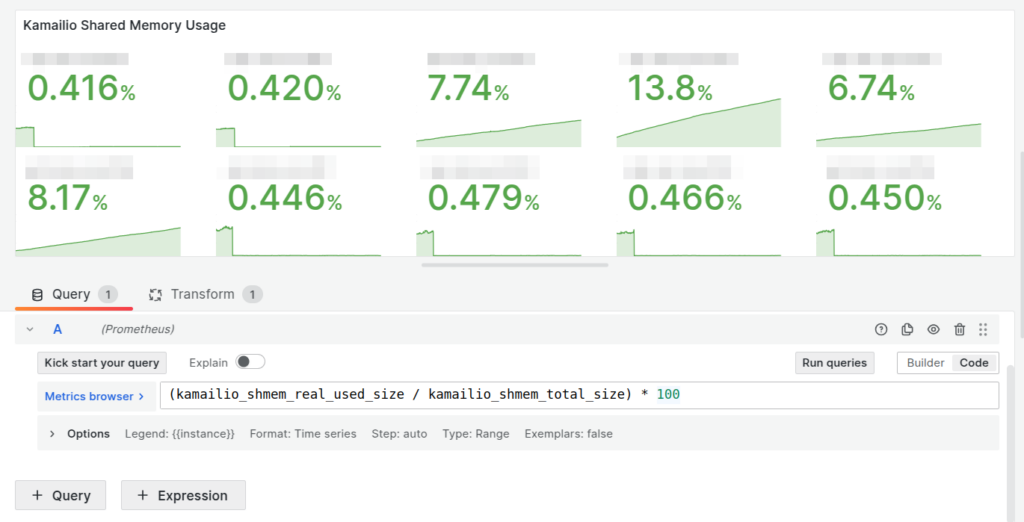
Shared memory usage per Kamailio instance
So we know there’s a memory leak on some boxes (different boxes run different modules) but which ones?
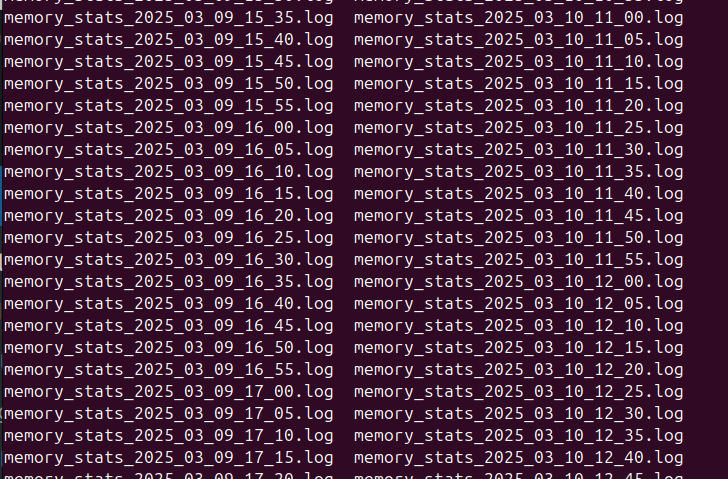
kamcmd will show you a breakdown of the shared memory usage per module, so I started with a little cronjob to dump the data every so often, with the idea I would diff the values and look for big increases.
Then the idea of processing the data from the files started to scare me.
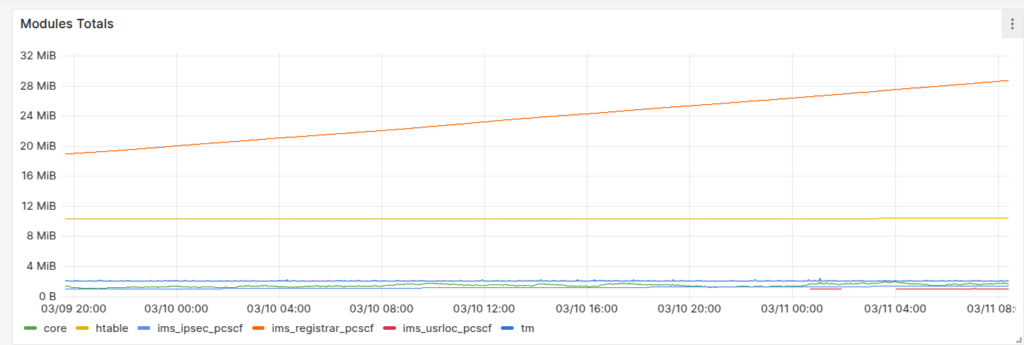
So in the end I went overboard and wrote a little script to get the memory usage of each module and export it via Prometheus, so I can track down what module is at fault.
If I were a better C programmer I’d have added this into the main Kamailio Prometheus module, but I’m terrible at C.
Clutter data describes real world things on the planet’s surface that attenuate signals, for example trees, shrubs, buildings, bodies of water, etc, etc. There’s also different types of trees, some types of trees attenuate signals more than others, different types of buildings are the same.
Getting clutter data used to be crazy expensive, and done on a per country or even per region basis, until the European Space Agency dropped a global dataset free of charge for anyone to use, that covered the entire planet in a single source of data.
So we can use this inside Forsk Atoll for making our predictions.
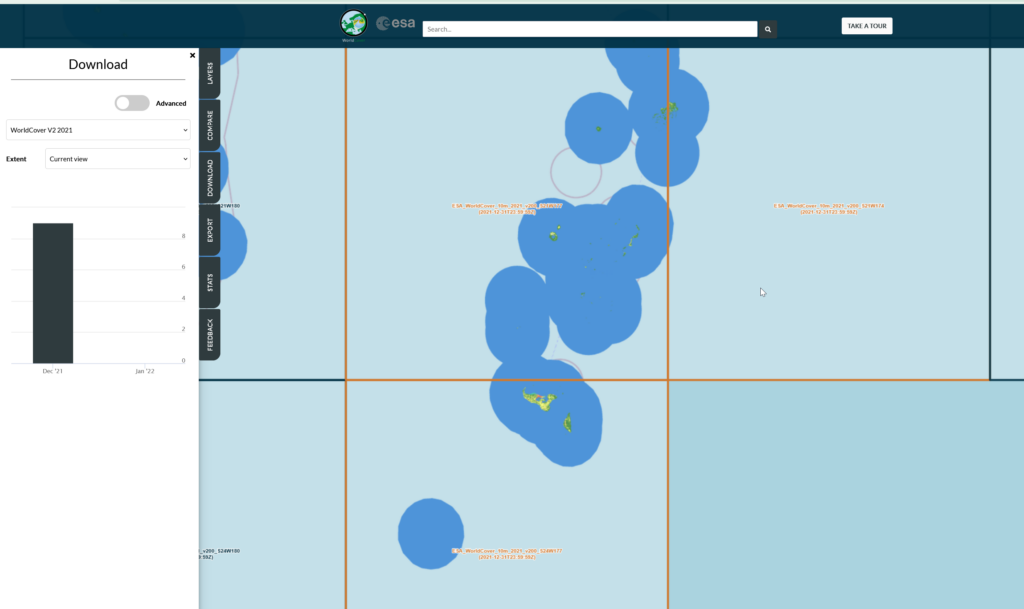
First things first we’ll need to create an account with the ESA (This is not where they take astronaut applications unfortunately, it just gives you access to the datasets).
Then you can select the areas (tiles) you want to download after clicking the “Download” tab on the right.
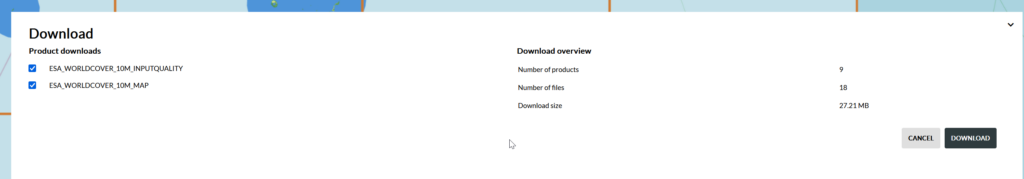
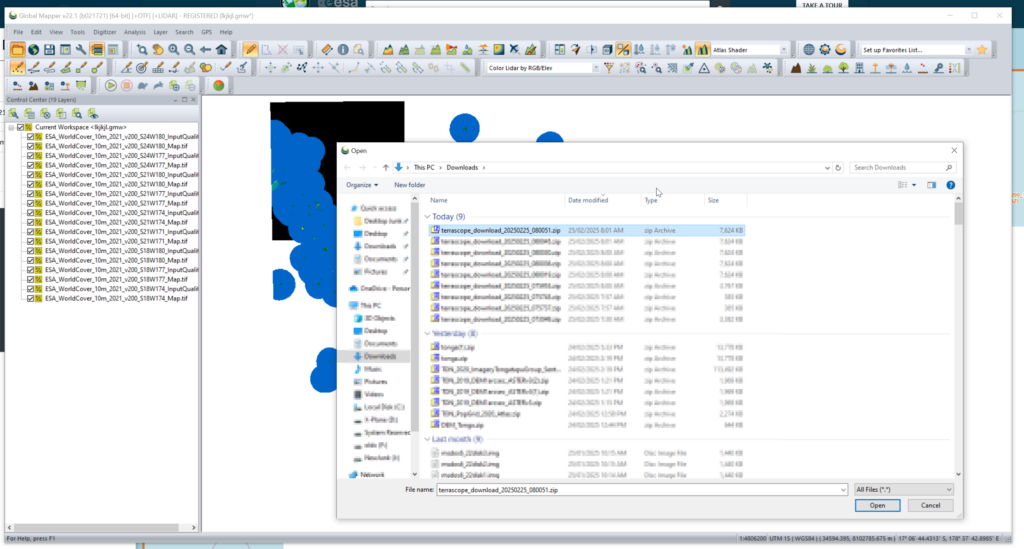
We get a confirmation of the tiles we’re download and we’ll get a ZIP file containing the data.
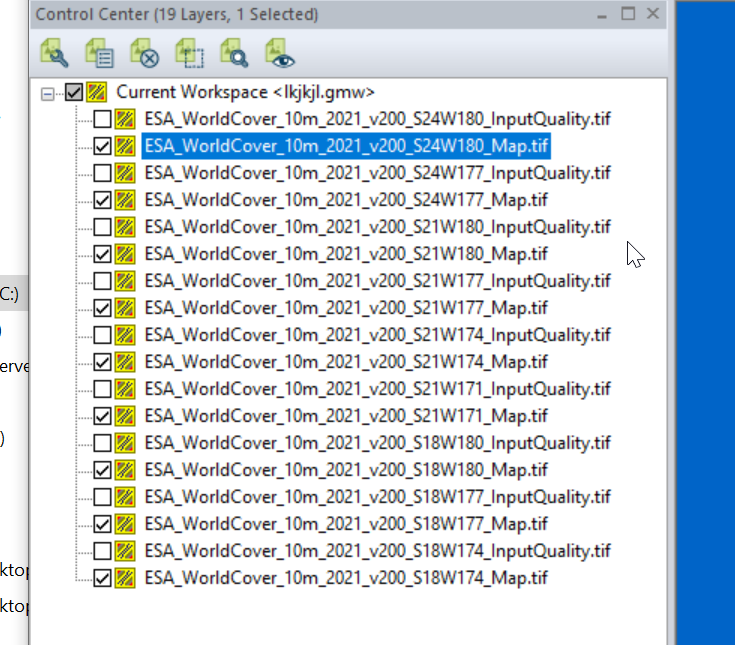
We can load the whole ZIP file (Without needing to extract anything) into GlobalMapper which loads all the layers.
I found the _Map.tif files the highest resolution, so I’m only exporting these.
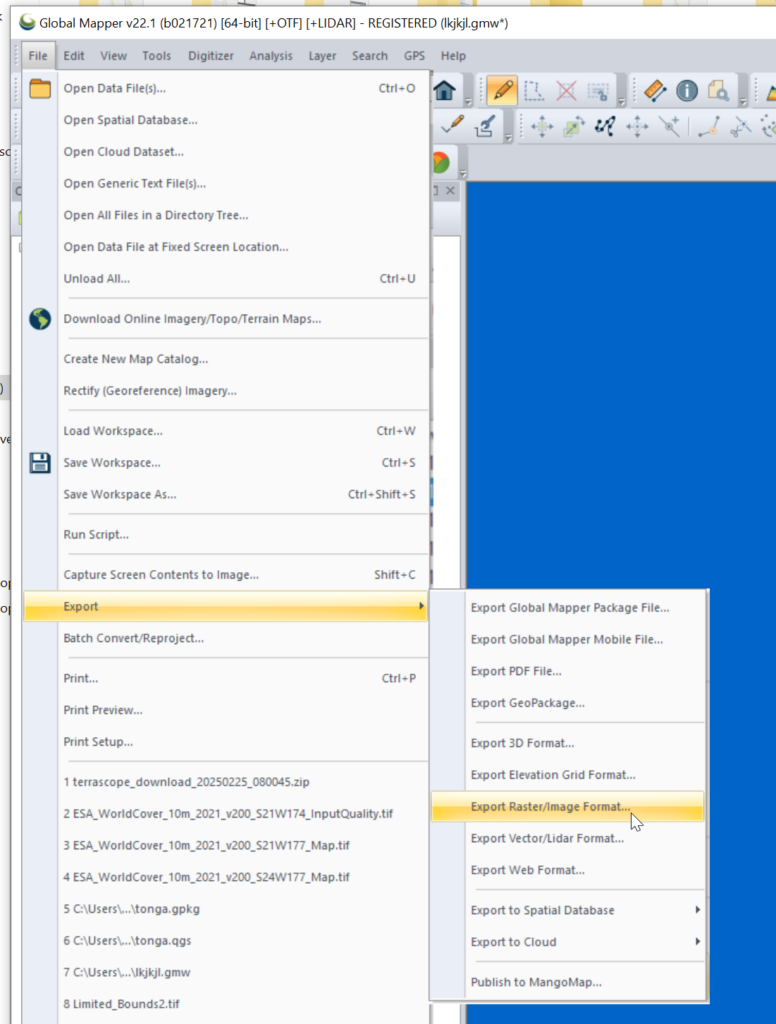
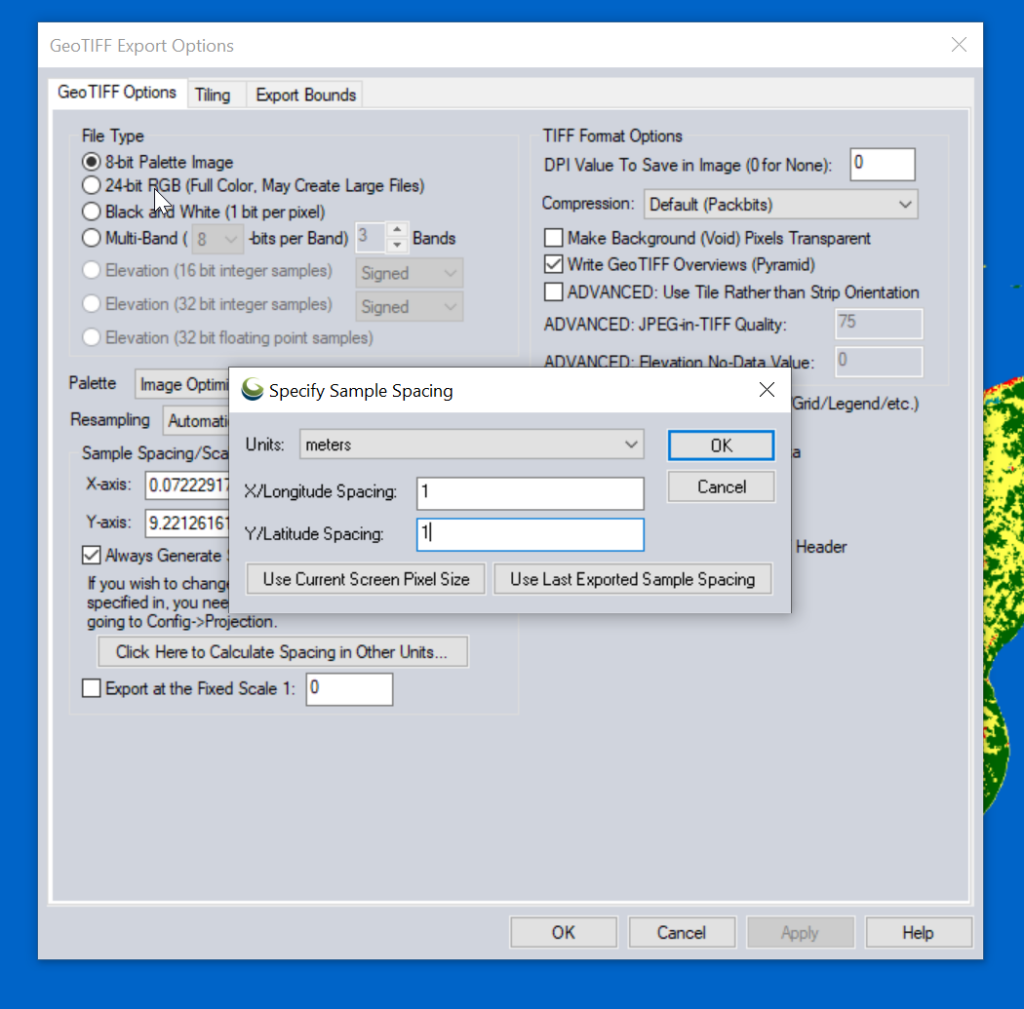
Then we need to export the data to GeoTiff for use in Atoll (The specific GeoTiff format ESA produces them in is not compatible with Atoll hence the need to convert), so we export the layers as Raster / Image format.
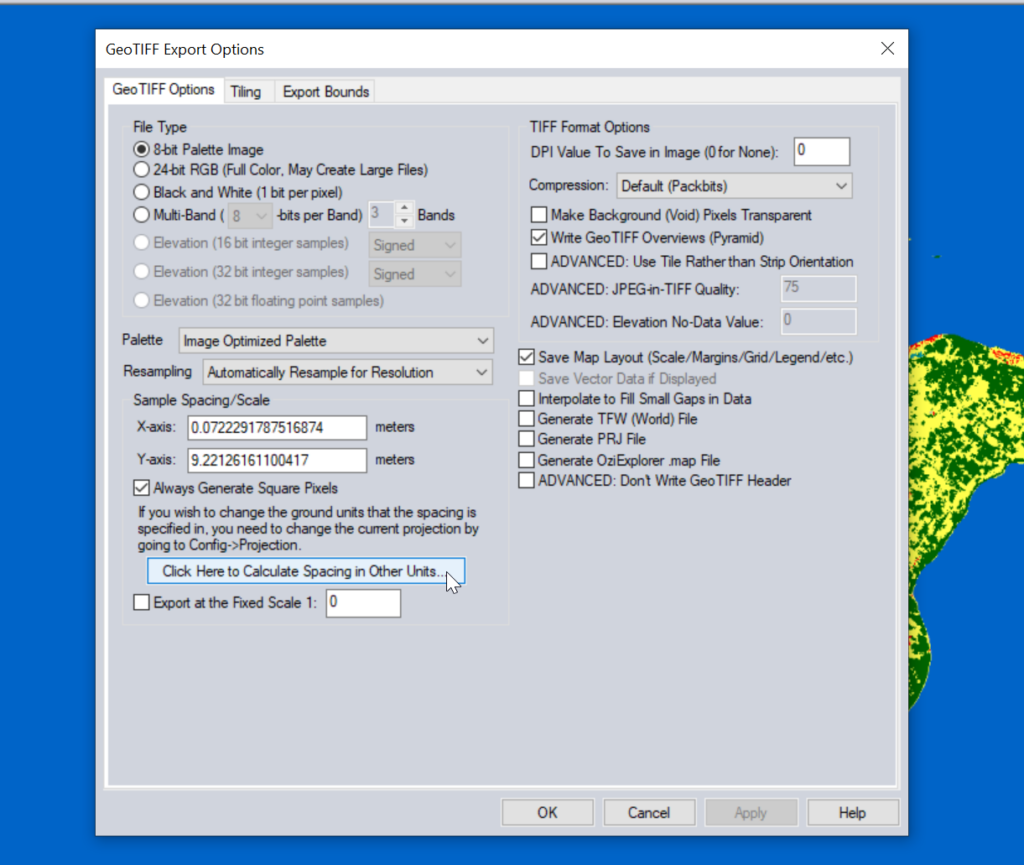
Atoll requires square pixels, and we need them in meters, so we select “Calculate Spacing in Other Units”.
Then set the spacing to meters (I use 1m to match everything else, but the data is actually only 10m accurate, so you could set this to 10m).
You probably want to set the Export Bounds to just the areas you’re interested in, otherwise the data gets really big, really quickly and takes forever to crunch.
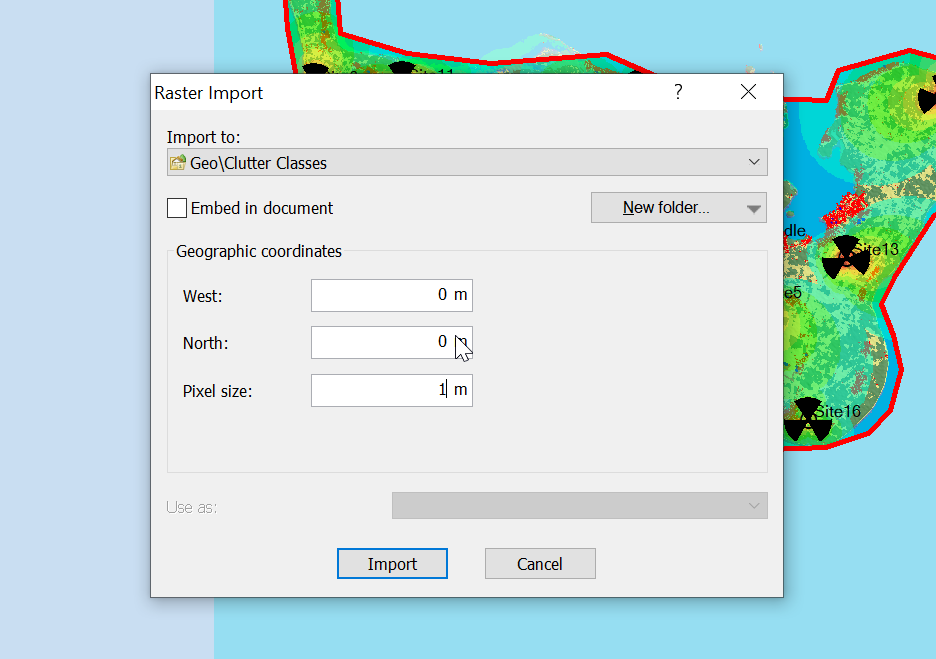
Now for the fancy part, we need to import it into Atoll.
When we import the data we import it as Raster data (Clutter Classes) with a pixel size of 1m.
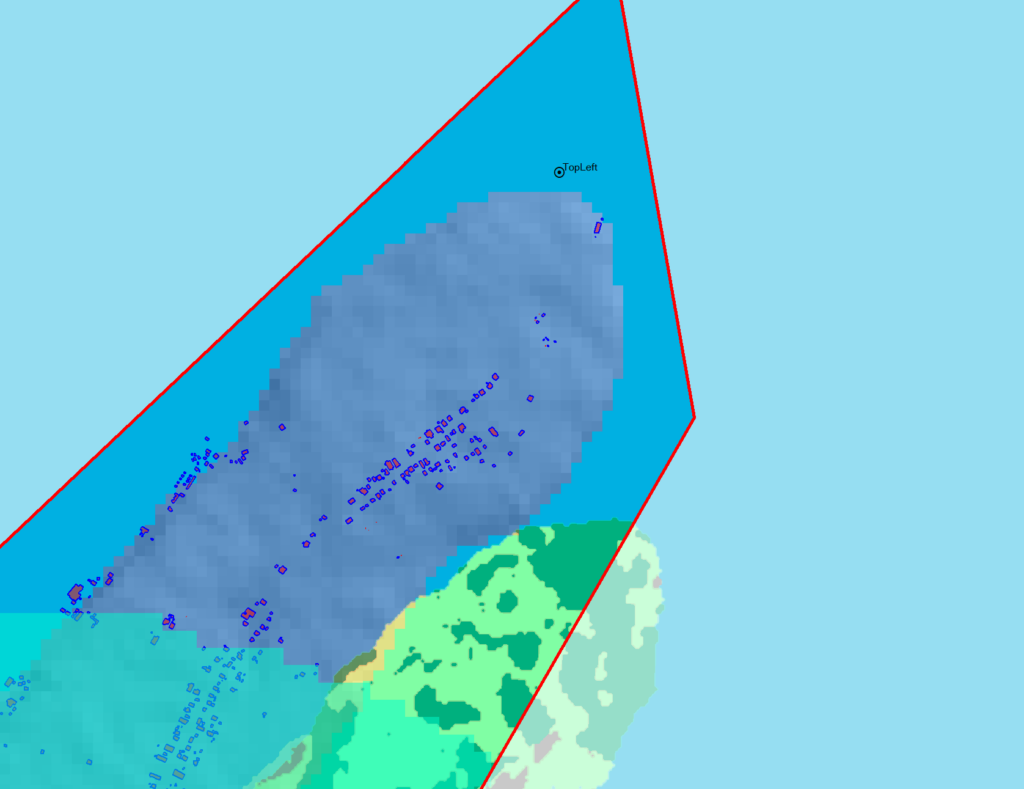
Alas when we exported the data we’ve lost the positioning information, so while we’ve got the clutter data, it’s just there somewhere on the planet, which with the planet being the size it is, is probably not where you need it.
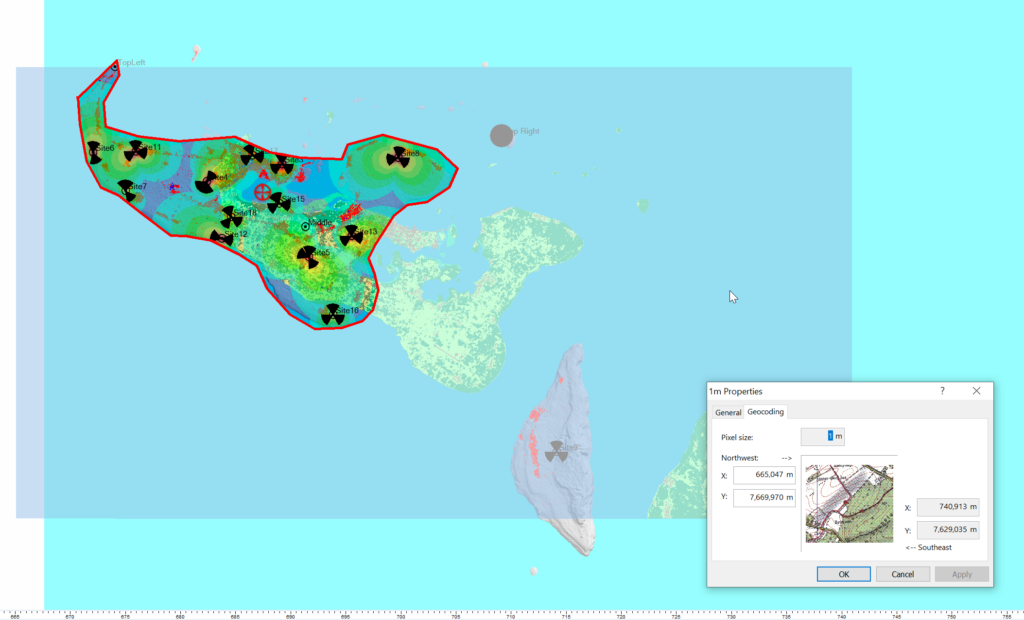
So I cheat, I start put putting the West and North values to match the values from a Cell Site I’ve already got on the map (I put one in the top left and bottom right corners of the map) and use that as the initial value.
Then – and stick with me, this is very technical – I mess with the values until the maps line up into the correct position. Increase X, decrease Y, dialing it it in until the clutter map lines up with the other maps I’ve got.
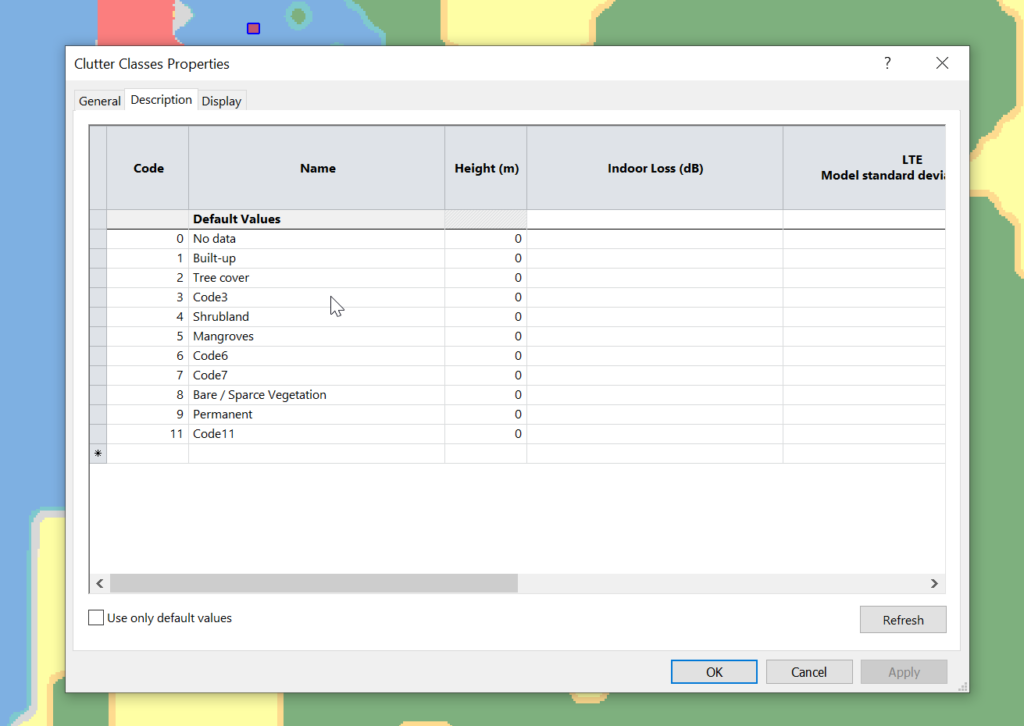
Right, now we’ve got the data but we don’t have any values.
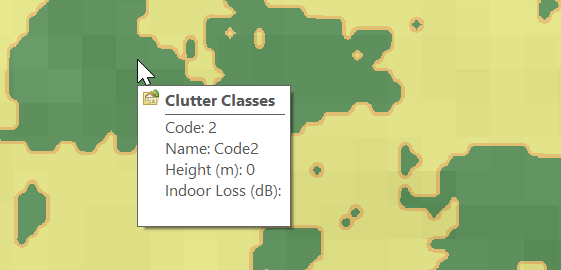
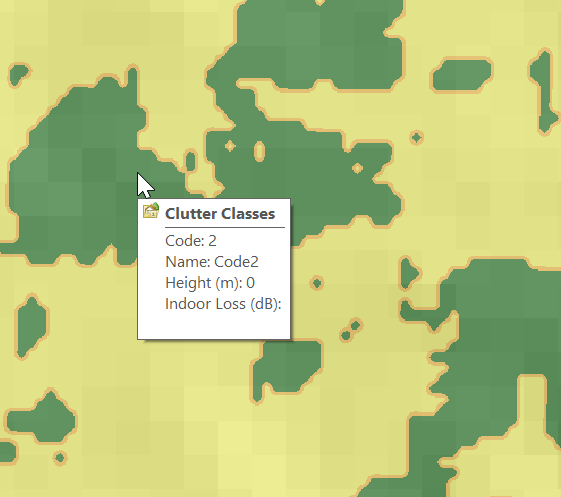
Each color represents a clutter class, but we haven’t set any actual height or losses for that material.
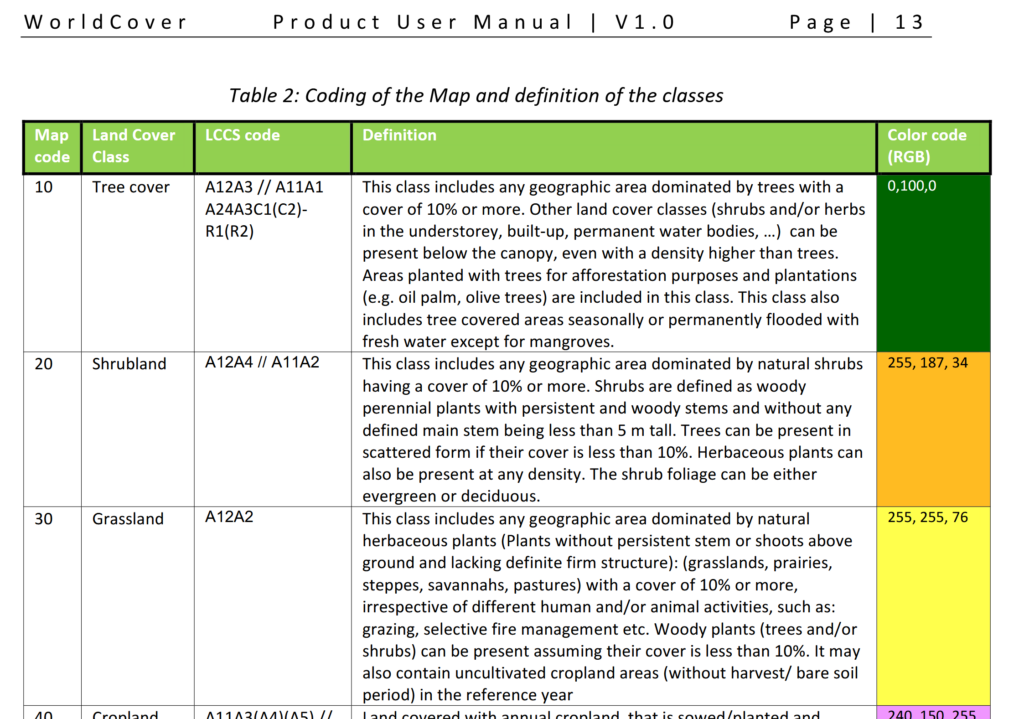
Alas the Map Code does not match with the table in the manual, but the colours do, here’s what mine map to:
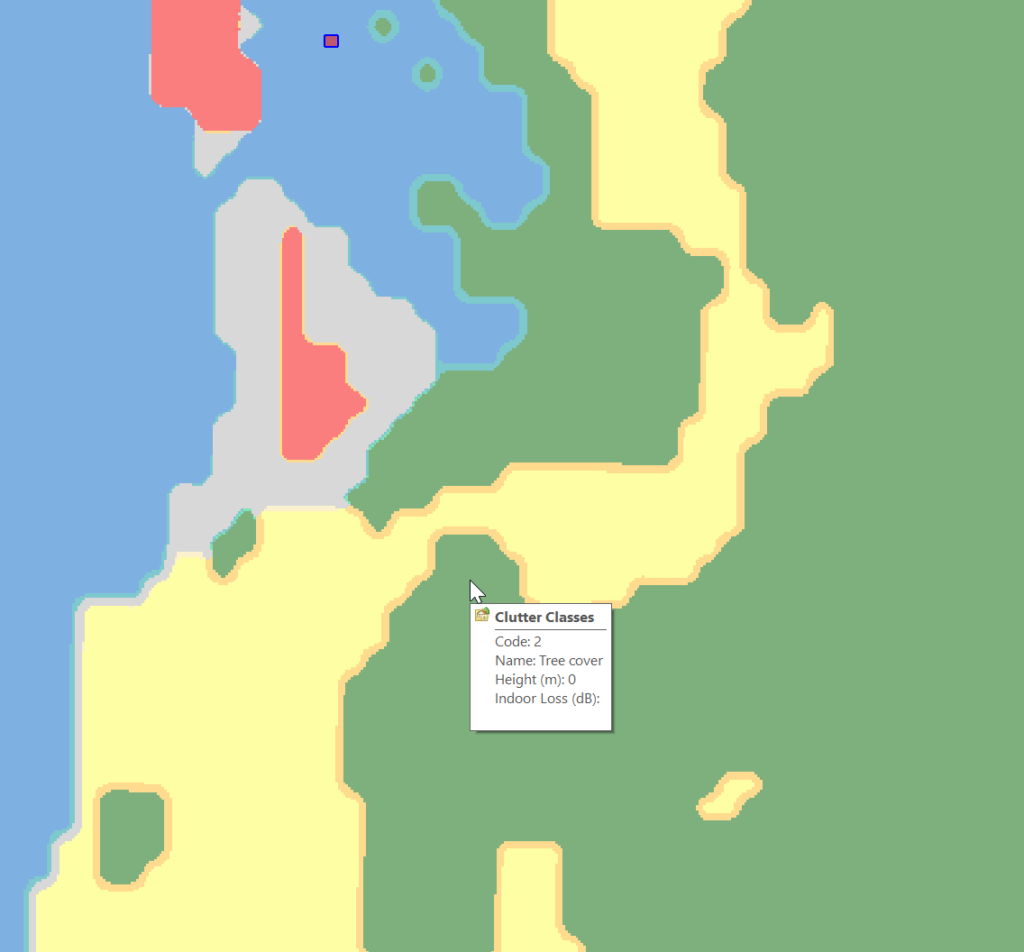
Which means when hovering over a layer of clutter I can see the type:
Next we need to populate the heights, indoor and outdoor losses for that given clutter. This is a little more tricky as it’s going to vary geography to geography, but there’s indicative loss numbers available online pretty easily.
Once you’ve got that plugged in you can run your predictions and off you go!
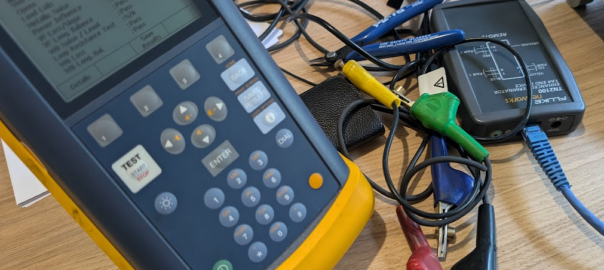
Because I’m a sucker for accessories for tools, I bought a Fluke TN2100 “Enhanced Terminator Far End Device”.
This device was made to go with the Fluke CopperPro Series II (Aka Fluke 990DSL), and is required for doing certain qualifications on the line, such as profiling the behavior of the line at different frequencies, wideband noise levels, etc.
This is all to qualify the quality of a loop / pair (or pairs – Can do up to 2 pairs / 4 cables) as being capable of supporting a variety of services like A/V/DSL as well as E1s / ISDN services, EMF, etc, etc.
It’s a super useful feature, if your loop is rubbish, putting an E1 circuit on it will end up with a high bit-error-rate, and putting a DSL circuit on it will see it constantly loose sync, so being able to qualify if the loop is any good beforehand is a must.
Alas the unit I’ve got came from eBay, and didn’t come with the leads, there’s just an RJ45 port on the terminator, with no indication as to what’s what.
So here’s the answer (which isn’t in any manual I could find) which I found through trial-and-error and cracking the case open to work out what was what:
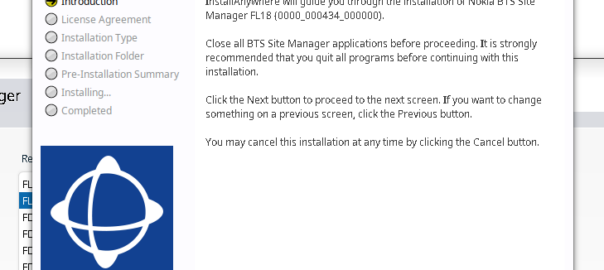
Another post in the “vendors thought Java would last forever but the web would just a fad” series, this one on getting Nokia BTS Site Manager (which is used to administer the pre-Airscale Nokia base stations) running on a modern Linux distro.
For starters we get the installers (you’ll need to get these from Nokia), and install openjdk-8-jre using whichever package manager your distro supports.
Once that’s installed, then extract the installer folder (Like BTS Site Manager FL18_BTSSM_0000_000434_000000-20250323T000206Z-001.zip).
Inside the extracted folder we’ve got a path like:
BTS Site Manager FL18_BTSSM_0000_000434_000000-20250323T000206Z-001/BTS Site Manager FL18_BTSSM_0000_000434_000000/C_Element/SE_UICA/Setup
The Setup folder contains a bunch of binaries.
We make these executable:
chmod +x BTSSiteEM-FL18-0000_000434_000000*
Then run the binary:
sudo ./BTSSiteEM-FL18-0000_000434_000000_x64.bin
By default it installs to /opt/Nokia/Managers/BTS\ Site/BTS\ Site\ Manager
And we’re done. Your OS may or may not have built a link to the app in your “start menu” / launcher.
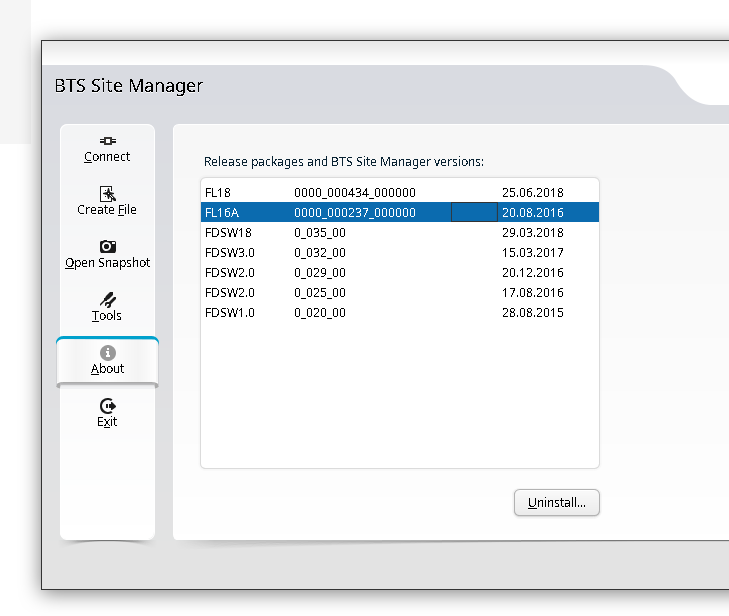
You can use one BTS manager to manage several different versions of software, but you need the definitions for those software loaded.
If you want to load the Releases for other versions (Like other FLF or FL releases) the simplest way is just to install the BTS site manager for those versions and just use the latest, then you’ll get the table of installed versions in the “About” section that you can administer.
Turns out it was great training for a career in telecom; I learned basic rigging, working at heights, electrical work, patching rats nests of cables and the shared camaraderie that comes from having stayed up all night working on something no one would ever notice, unless you hadn’t done it.
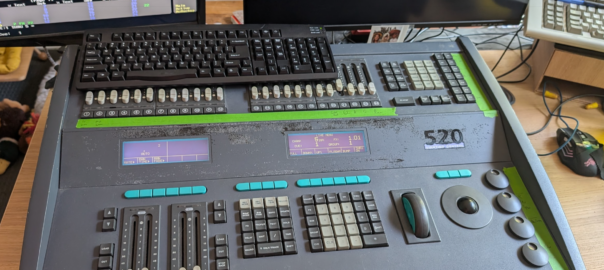
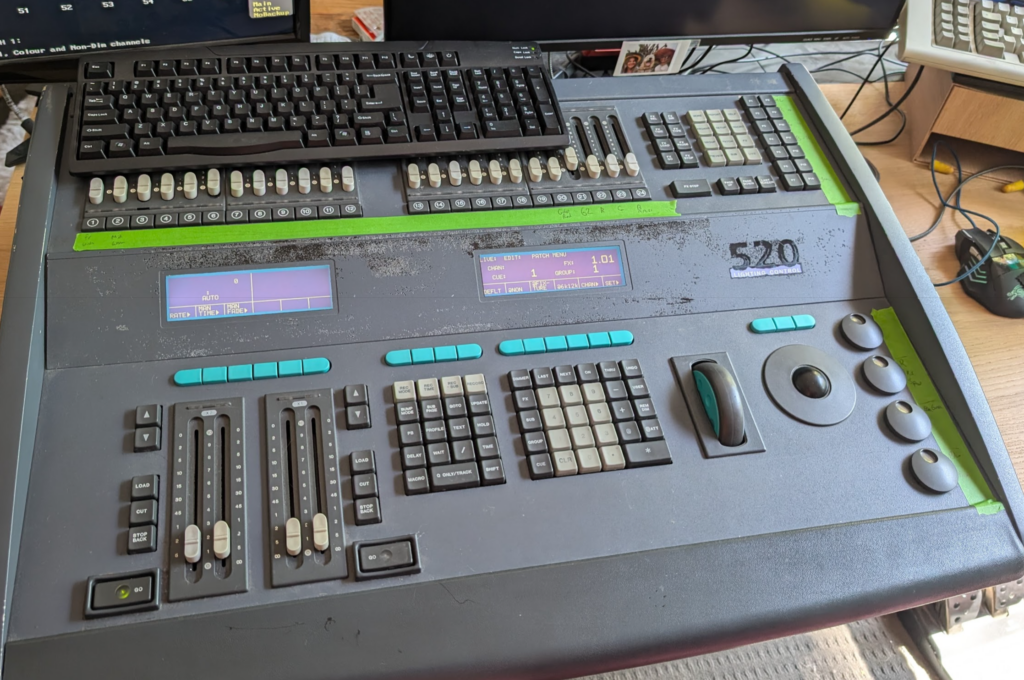
At the time the Strand 520i lighting console was the coolest thing ever, it had support for 4 DMX universes (2048 channels – Who could ever need more than that!?) and cost more than a new car.
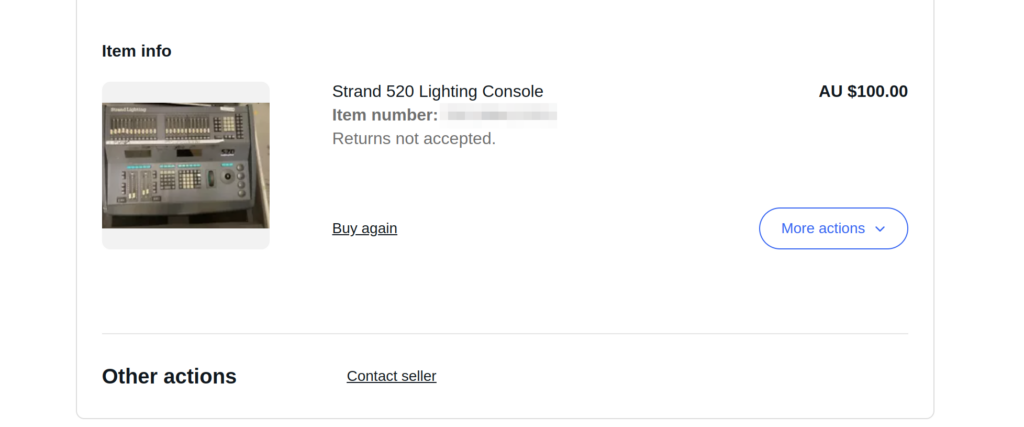
One late Friday night browsing online I found one for sale by a University in the state I live in, for $100 or best offer. You better believe I smashed the buy now button so hard my mouse almost broke. I was going to own my very own Strand 520.
I spent the weekend reading through the old manuals, remembering how to use all the features, then dragged my partner for the road trip the following Monday morning to pick it up and bring it home.
But before I could do anything fun I had to find a PS/2 keyboard and a VGA screen, which took me a few more days (a visit to the tip was the easiest way to get a hold of them).
Then I needed something to receive DMX – I found everything now uses ArtNet (DMX over IP) and there’s visualisers for simulating an arena / stage lighting setup, but all take ArtNet now, so I ordered a DMX to ArtNet converter.
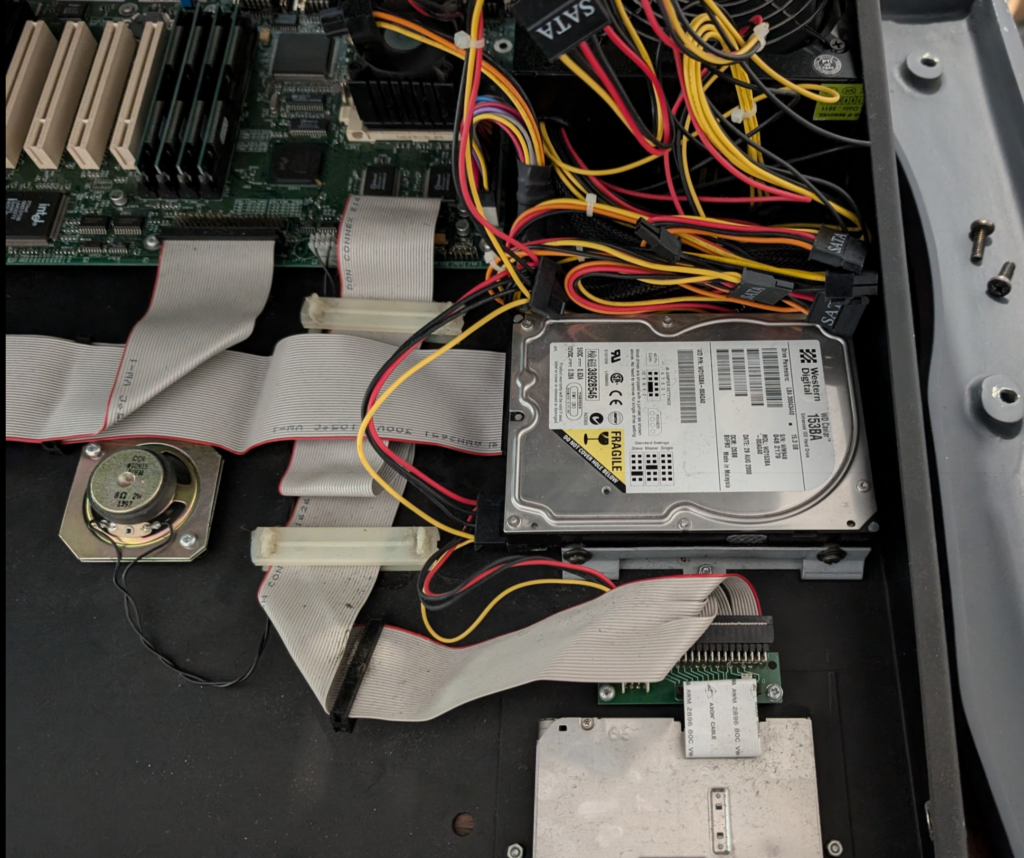
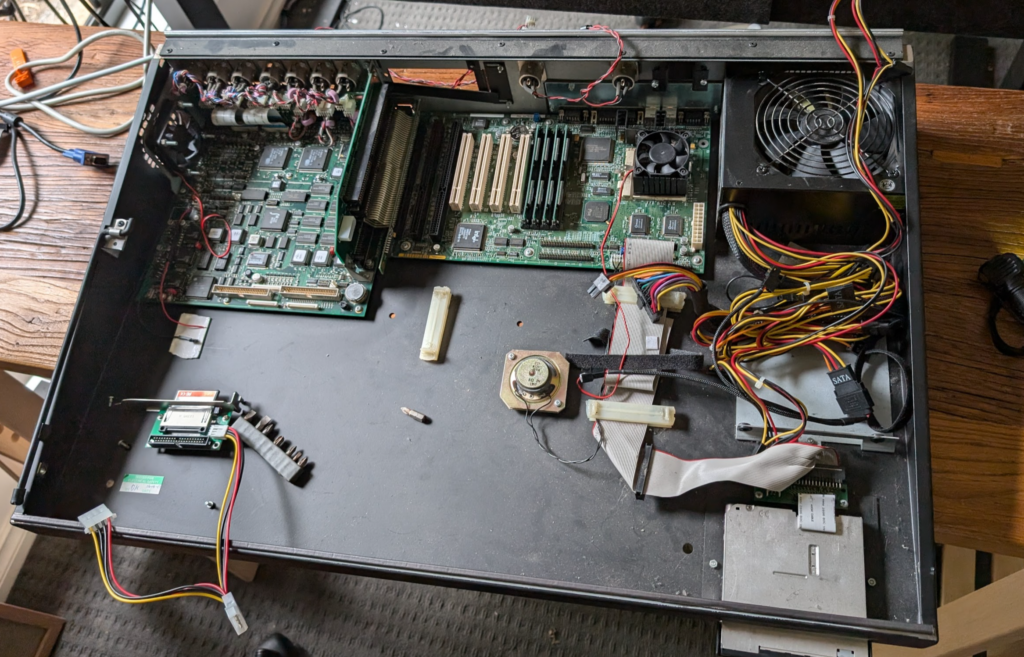
Inside the unit is pretty much a standard PC (An “OG” Pentium in the Strand 520) with an ISA card for all the lighting control stuff.
The clicking hard drive managed to boot, but I didn’t think it’d last long, having been made more than 25 years prior. So I created a disk image and copied the file system onto a CF card using a CF to IDE adapter. This trick meant it booted faster than ever before.
Clicky HDD before it became a CF
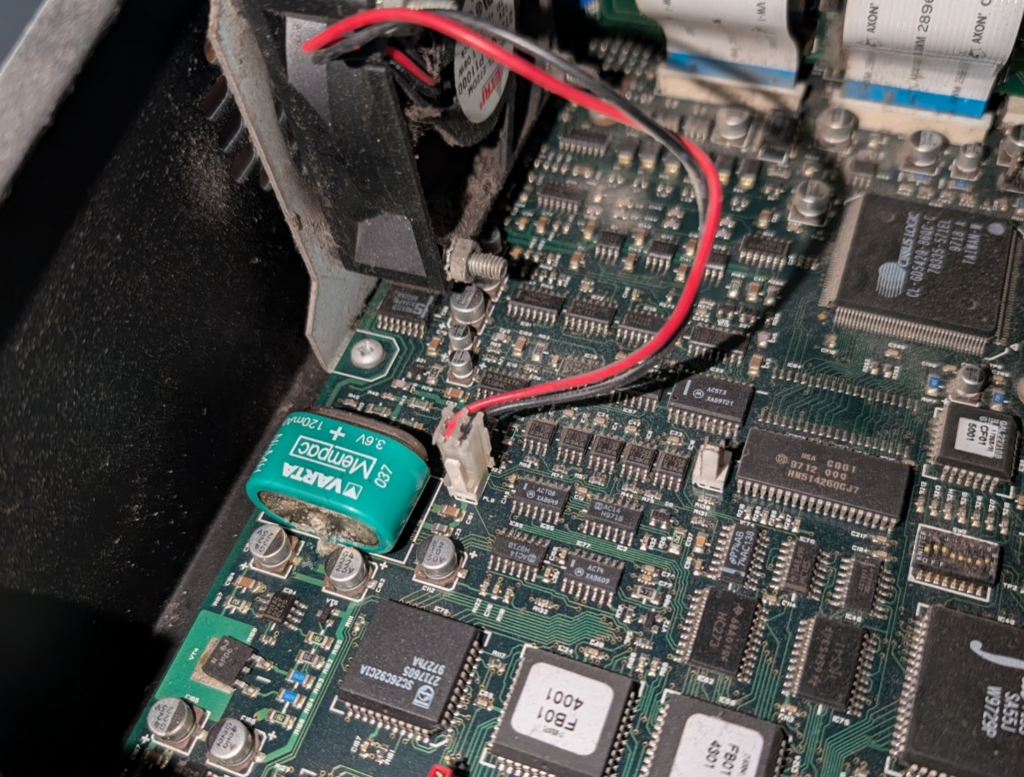
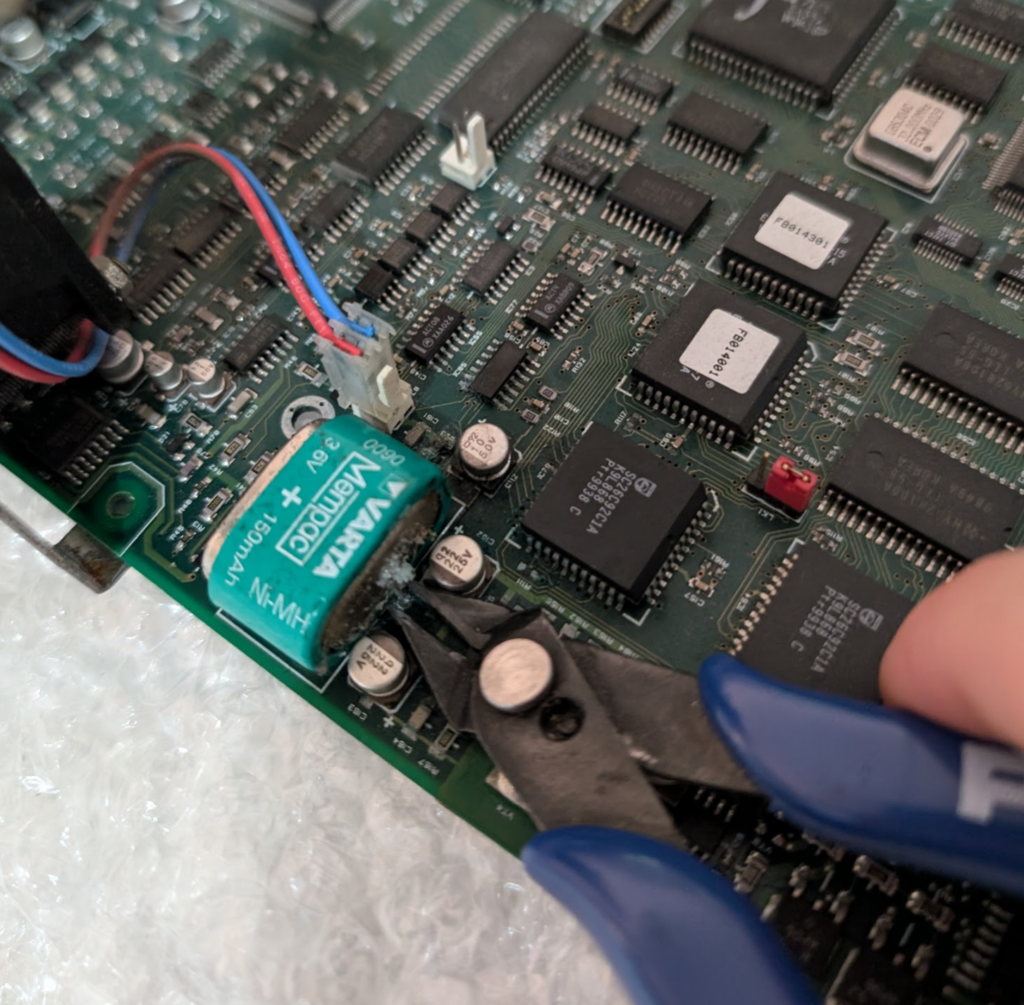
One thing I’d read about online was the VARTA battery had a tendency to leak battery acid all over the PCB. This one had yet to fully spill its guts, but was looking a bit bulgey and had started to leak a little already.
The battery (I’d read) was only for storing info in a power loss scenario, and if the battery isn’t present it just slows the boot time as everything has to be read from disk, so I took the leap of faith and cut the battery out, and lo, it still all boots.
Slightly furry VARTA battery
So now I was OK to get the desk online properly, but was getting semi-regular lock ups where DMX would stop outputting and inputs on the console were not read, but the underlying PC was still working.
I spent a lot time debugging this. BIOS settings, interrupts, I dived into how ISA works, replaced the battery I removed with a brand new one, and at one point I broke out the oscilloscope, but nothing worked.
Around the same time I noticed the Ethernet port (BNC!) would work if I just ran plain DOS (could ping from DOS but when the application started the NIC would go dead), which made me think I may be facing a hardware fault with the “CS” – the show processor for the console which is what the motherboard connects to via ISA.
The desk itself with the face off, and the CF adapter being mounted
Alas being almost 30 years old (this unit was made in 1996) there aren’t a great number of them around to test with, so I could try swapping out the “CS” board. What I did find was another complete console on eBay for $50 but it was in the UK, and they weigh a lot. Shipping this thing was not an option.
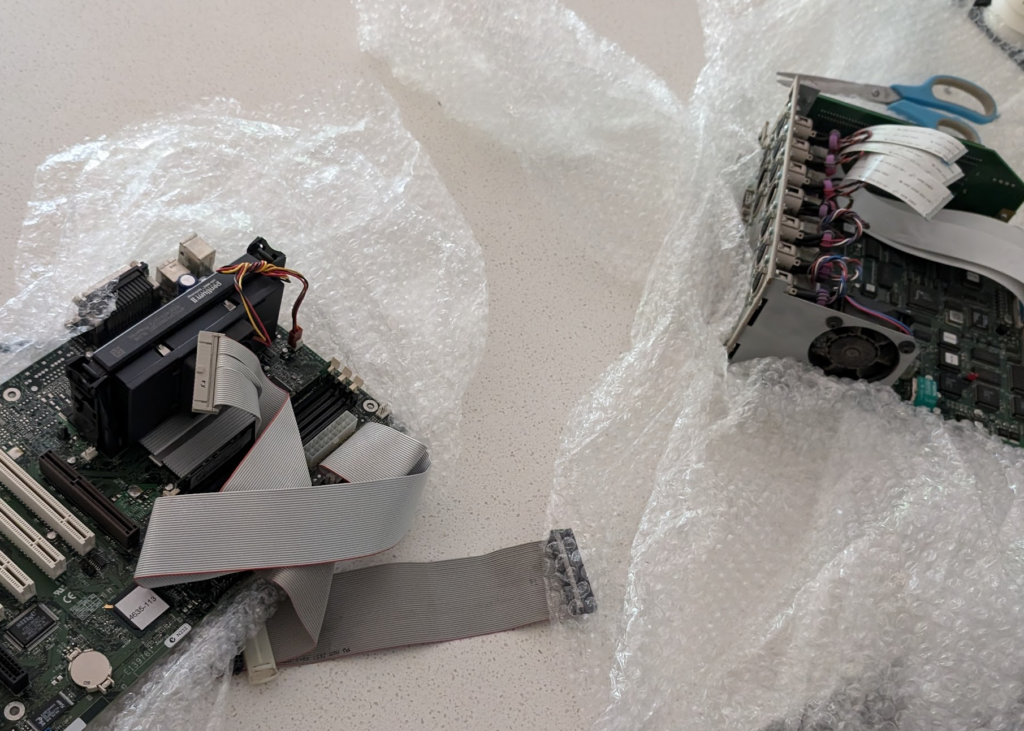
But for a bit of of extra cash the seller was willing to crack the case open and strip out the two main boards and post me just those. This had added bonus that the motherboard and CPU of the board sent from the UK was a 520i meaning it has the Pentium II processor – This Strand 520 was now going to be a Strand 520i.
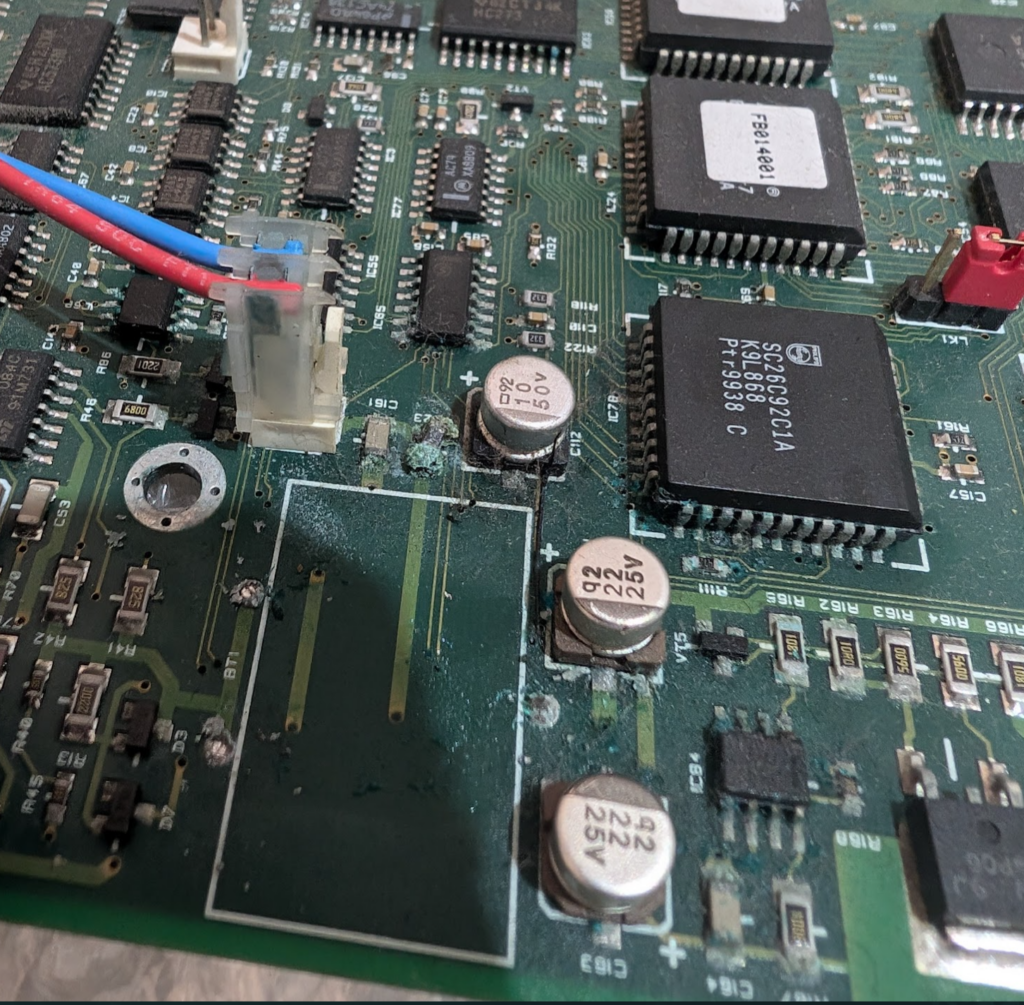
A month later a box appeared at my door containing the boards, but the battery on the CS board from the UK had well and truly spilled its guts, leaving some toxic sludge around all the components nearby. A can of PCB cleaner and a toothbrush (which I will not be using to brush teeth with anymore) and I’d cleaned it up as best I could, but the fan output from the board was well and truly dead, with some of the SMD components just eaten by the acid.
So I put everything back into the case and wired it up. The mounts for the Motherboard were slightly different, and the software that is used for the 520i is different from the 520 (without the i).
The HDD from the UK was unable to boot, but I was able to get it to spin up enough to copy off the ~5Mb of files I needed, then I did a fresh install of MS DOS and copied the installer for the StrandOS.
Finally fully functional
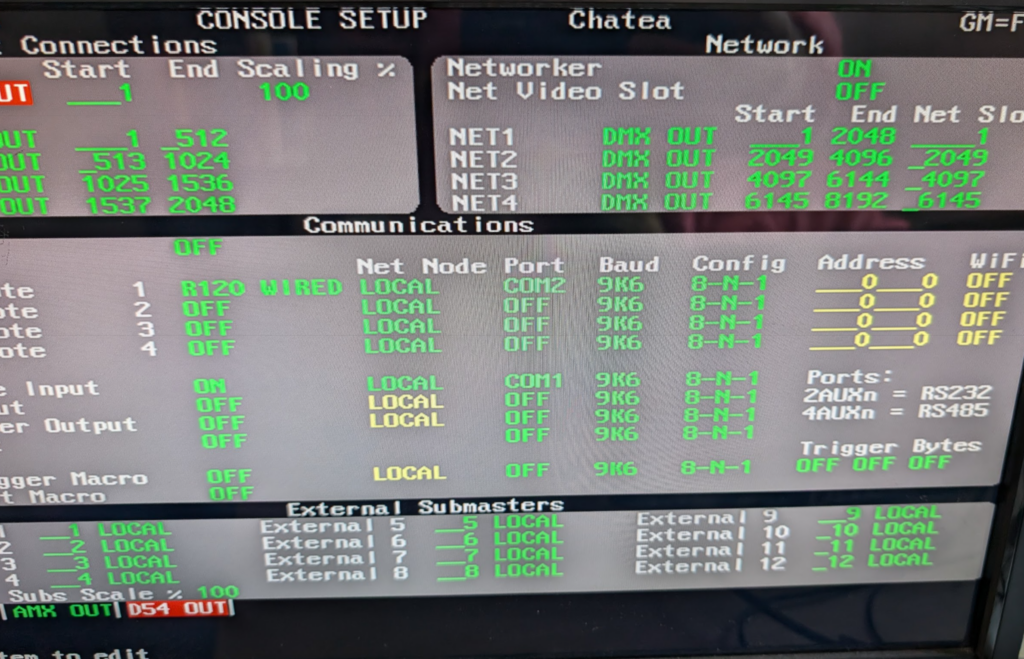
Finally I had a stable working console. Not just that but the Strand Networker application was now available to me. So I plugged into the 10Mbps connection and set the console to output to Network as well as DMX.
Enabling the “networker” for network DMX transmission
I cranked open Wireshark and there was a mystery signal sent to the broadcast address on UDP…
I patched a single DMX channel and changed the value and when I viewed the data in Wireshark I could see a hex representation of the DMX 0-255 value.
Easy I thought to myself, it’ll just be a grid of channels, each with their value as hex. Ha! I was wrong.
Turns out Strand Shownet used a conditional form of “Run Length Encoding” compression, where if you’ve got channels 1 through 5 at 50% rather than encoding this is 5 bytes each showing 0x80, it uses 2 bytes, to indicate 5 sequential channels (run length) and then the value (0x80). Then there’s another bit to denote how many forward places to move and if the next channel is using RLE or not.
The code got messy; it’s not the best thing I’ve ever written but it works for 2 full universes of DMX (I need to spend more time to understand where the channel encoding overflow happens as I end up a few channels ahead of where I should be on universe 3 and above).
The code is available on Github and I’d love to know if anyone’s using it with these old dinosaurs!
For the past few years I’ve run a Dell R630 as one of our labs / testing, it’s hosted down the road from me, and with 32 cores and 256 GB of RAM, it’s got enough grunt to run what we need for testing stuff on the East coast and messing around. We’ve got a proper DC with compute in Sydney and Perth, but for breaking stuff, I wanted my own lab.
This box started on VMware but after I’d see really odd disk IO behavior over a long period of time I couldn’t get to the bottom of.
Things would hang, for example you’d go to edit a file on a VM in vi and have to wait 20 seconds for the file to open, I could cat the same file instantly, and other files I could vi instantly.
I initially thought it was that dreaded issue with Ubuntu boxes being unable to revolve their own hostname and waiting for DNS to time out every. single. time. it. did. anything, but I ruled that out when I got the same behavior with live CDs and non Linux OSes.
In the end I narrowed it down to being related to Disk IO. I read Matt Liebowitz book on VMware VSphere Performance, assuming there was a setting somewhere inside VMware I had wrong.
But switching hypervisors didn’t fix the issue, so I could rule that out. So I splashed out and swapped the 16k magnetic SAS drives in the RAID with new SSDs, but still the problem persisted – It wasn’t the drives and I wasn’t seeing a marked increase in performance.
I did a bunch of turning on the PERC card with disk caching, write ahead, etc, but still the problem persisted.
At this stage I was looking at the PERC card or (less likely) the CPU/motherboard/RAM combo.
So over a quiet period, I moved some workloads back onto one of the old 16k magnetic SAS drives that I had pulled out to replace with the SSDs, and benchmarked the disk performance on the standalone SAS drive to compare against the RAID SSD performance.
I used iozone3 to benchmark the performance with:
iozone -t1 -i0 -i2 -r1k -s1g /tmp
Here’s how the SSDs in the RAID two compare to a standalone SAS drive (not in RAID):
Metric
LXC on SSD RAID
Standalone SAS Drive
Difference (Standalone vs. RAID)
Initial Write (Child)
314,682.91 kB/sec
382,771.88 kB/sec
+21.6%
Initial Write (Parent)
177,522.16 kB/sec
119,112.43 kB/sec
-32.9%
Rewrite (Child)
428,456.94 kB/sec
470,486.44 kB/sec
+9.8%
Rewrite (Parent)
180,007.46 kB/sec
73,721.11 kB/sec
-59.0%
Random Read (Child)
404,707.62 kB/sec
406,057.00 kB/sec
+0.3%
Random Read (Parent)
404,410.90 kB/sec
397,718.31 kB/sec
-1.7%
Random Write (Child)
126,042.59 kB/sec
355,304.22 kB/sec
+181.9%
Random Write (Parent)
4,497.75 kB/sec
68,971.35 kB/sec
+1,434%
That Random Write (Parent) at the bottom – Yeah that would explain the “weird” behavior I’ve been seeing on guest OSes. As part of editing a file with vi it creates a lock file, that would be written to a random sector, and thus taking such a long time (while cat wouldn’t do the same).
Okay – So now I know it’s the PERC at fault or the RAID config on it.
Next I put another SSD, the same type as those in the RAID, but as a standalone drive (Not in the RAID) and here’s the results:
Metric
RAID-15 SSD
SSD Standalone
Difference (WD vs. RAID-5)
Sequential Writes (Child)
314,682.91 kB/sec
511,280.50 kB/sec
+62.5%
Sequential Writes (Parent)
177,522.16 kB/sec
128,016.83 kB/sec
-27.9%
Sequential Rewrites (Child)
428,456.94 kB/sec
467,547.38 kB/sec
+9.1%
Sequential Rewrites (Parent)
180,007.46 kB/sec
79,698.26 kB/sec
-55.7%
Random Reads (Child)
404,707.62 kB/sec
439,705.72 kB/sec
+8.6%
Random Reads (Parent)
404,410.90 kB/sec
437,549.83 kB/sec
+8.2%
Random Writes (Child)
126,042.59 kB/sec
319,127.09 kB/sec
+153.2%
Random Writes (Parent)
4,497.75 kB/sec
125,458.00 kB/sec
+2,689.3% (!)
So sequential write and rewrites were slightly down on the standalone disk, but the other figures all look way better on the standalone SSD.
So that’s my problem, I figure it’s something to do with how the RAID is configured but after messing around for a few hours with all the permutations of settings I tried, I couldn’t get these figures to markedly improve.
As this is a lab box I’ll just dismantle the RAID and run each LXC container / VM on a local (non-RAID) SSD, as data loss from a dying disk is not a concern in my use case, but hopefully this might be of use to someone else seeing the same.
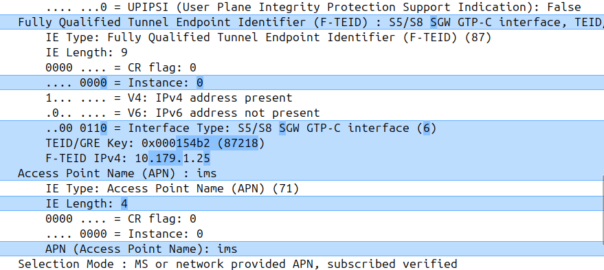
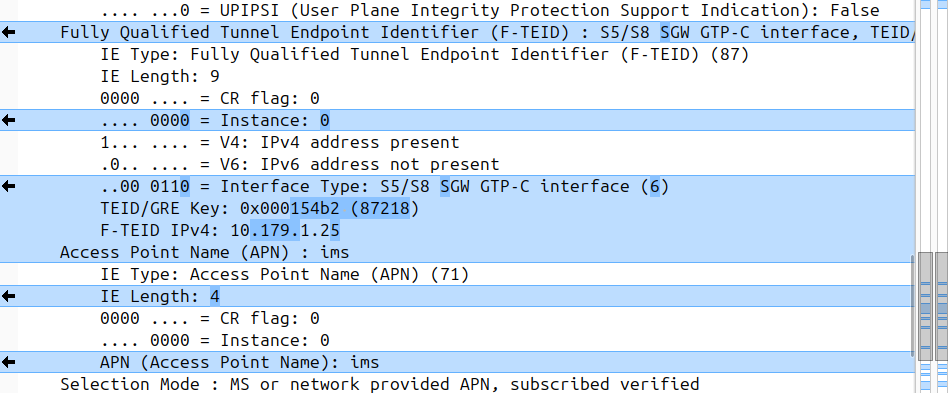
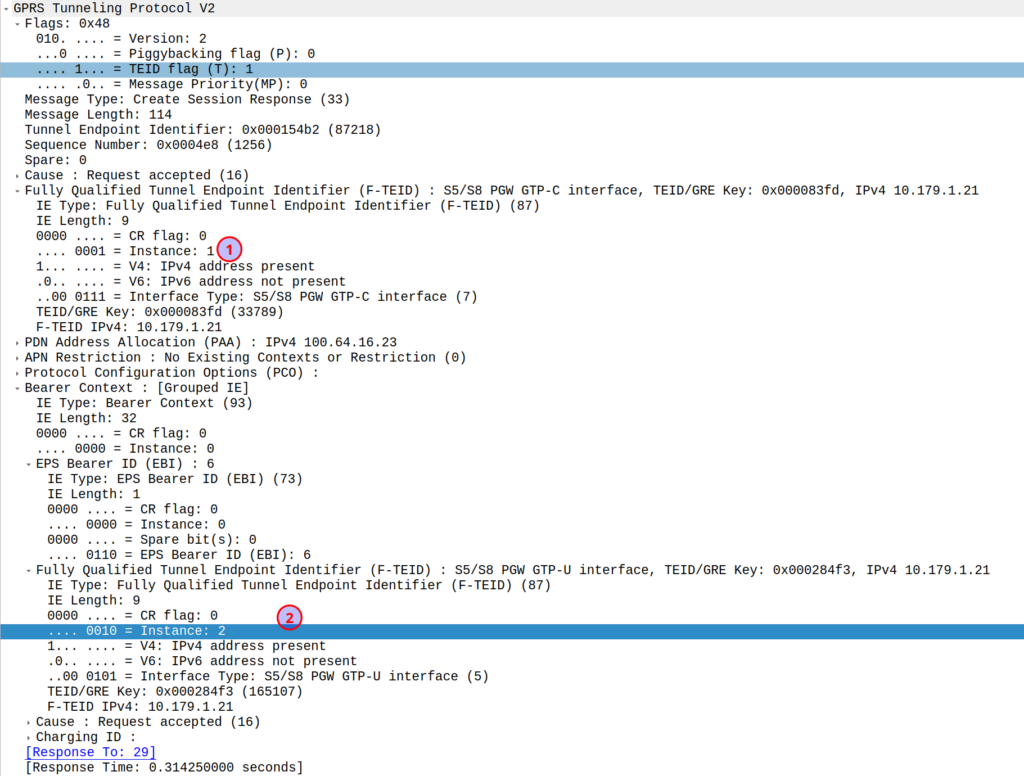
I was diffing two PCAPs the other day trying to work out what’s up, and noticed the Instance ID on a GTPv2 IE was different between the working and failing examples.
If more than one grouped information elements of the same type, but for a different purpose are sent with a message,
these IEs shall have different Instance values.
So if we’ve got two IEs of the same IE type (As we often do; F-TEIDs with IE Type 87 may have multiple instances in the same message each with different F-TEID interface types), then we differentiate between them by Instance ID.
The only exception to this rule is where we’ve got the same data, so if you’ve got one IE with the exact same values and purpose that exists twice inside the message.
Last year we deployed some Hughes HL1120W OneWeb terminals in one of the remote cellular networks we support.
Unfortunately it was failing to meet our expectations in terms of performance and reliability – We were seeing multiple dropouts every few hours, for between 30 seconds and ~3 minutes at a time, and while our reseller was great, we weren’t really getting anywhere with Eutelsat in terms of understanding why it wasn’t working.
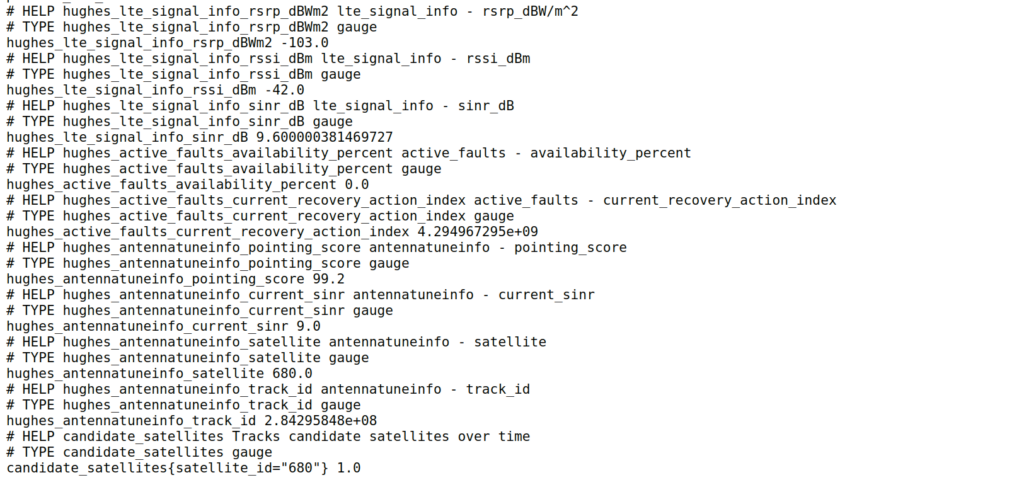
Luckily for us, Hughes (who manufacture the OneWeb terminals) have an unprotected API (*facepalm*) from which we can scrape all the information about what the terminal sees.
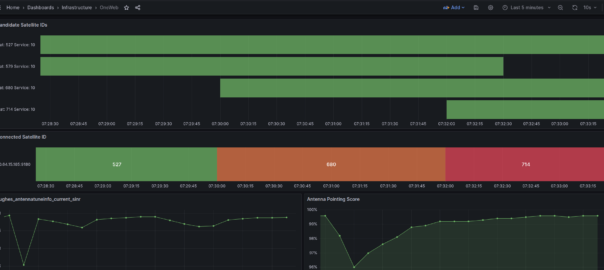
As that data is in an API we have to query, I knocked up a quick Python script to poll the API and convert the data from the API into Prometheus data so we could put it into Grafana and visualise what’s going on with the terminals and the constellation.
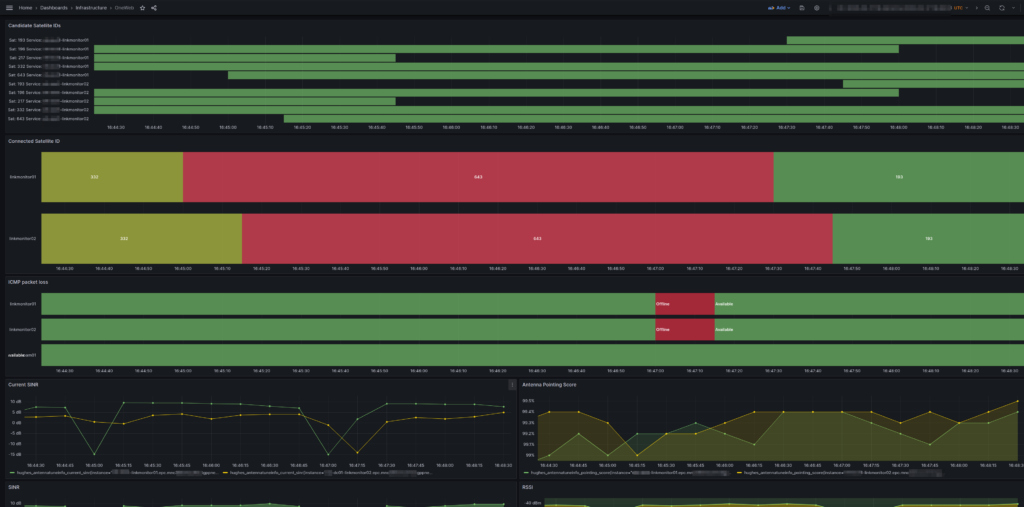
After getting all this into Grafana and combining it with the ICMP Blackbox exporter (we configured Blackbox to send HTTP requests and ICMP pings out of each of the different satellite terminals we had (a mix of OneWeb and others)) we could see a pattern emerging where certain “birds” (satellites) that passed overhead would come with packet loss and dropouts.
It was the same satellites each time that led to the drops, which allowed us to pinpoint to say when we see this satellite coming over the horizon, we know there’s going to be some packet loss.
In the end Eutelsat acknowledged they had two faulty satellites in the orbit we are using, hence seeing the dropouts, and they are currently working on resolving this (but that actually does require rockets, so we’re left without a usable service for the time being) but it was a fun problem to diagnose and a good chance to learn more about space.
Packet loss on the two OneWeb terminals (Not seen on other constellation) correlated with a given satellite pass
The repo has instructions for use and the Grafana templates we used.
At one point I started playing with the OneWeb Ephemeris data so I could calculate the azimuth and elevation of each of the birds from our relative position, and work out distances and angles from the terminal. The maths was kinda fun, but oddly the datetimes in the OneWeb ephemeris data set seems to be about 10 years and 10 days behind the current datetime – Possibly this gives an insight into OneWeb’s two day outage at the start of the year due to their software not handling leap years.
Despite all these teething issues I’m still optimistic about OneWeb, Kupler and Qianfan (Thousand Sails) opening up the LEO market and covering more people in more places.
Update: Thanks to Scott via email who sent this: One note, there’s a difference between GPS time and Unix time of about 10 years 5 days. This is due to a) the Unix epoch starting 1970-01-01 and the gps epoch starting 1980-01-05 and b) gps time is not adjusted for leap seconds, and ends up being offset by an integer number of seconds.
One of the really neat features about using automated RF planning tools like Forsk Atoll is you’re able to get it to automatically try out tweaks and look at how that impacts performance.
In the past you’d adjust something, run the simulation again, look at the results and compare to what you had before,
Atoll’s ACP (Automatic Cell Planning) module allows you to automate this, and in most cases, it does a better job than I would!
Today we’ll look at Cell Site Selection in Atoll.
To begin with we’ll limit the computation area down to a polygon we draw around the area in question,
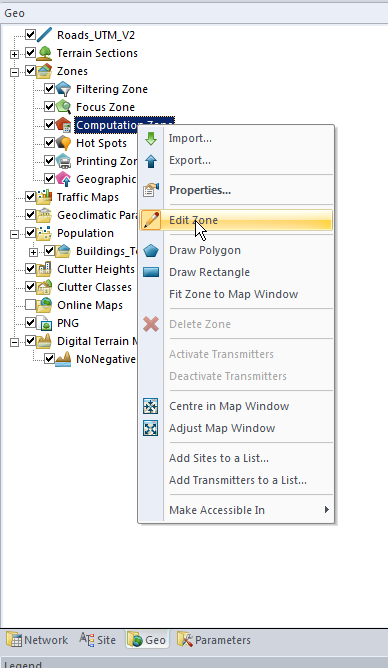
In the Geo tab we’ll select Zones -> Computation Zone and select Edit
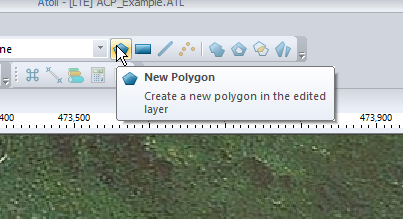
We’ll create a new Polygon and draw around the area we are going to analyze. You can automate this step based on population levels, etc, if you’ve got that data present.
So now we’ve set our computation area to the selection, but if we didn’t do this, we’d be computing for the whole world, and that might take a while…
Generating Candidate Sites
Atoll sucks at this, I’ve found if your computation zone is set, and it’s not a rectangle, bad things happen, so I’ve written a little script to generate candidates for me.
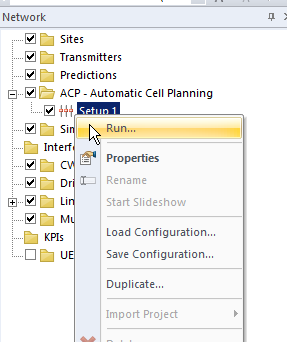
Creating an new ACP Job
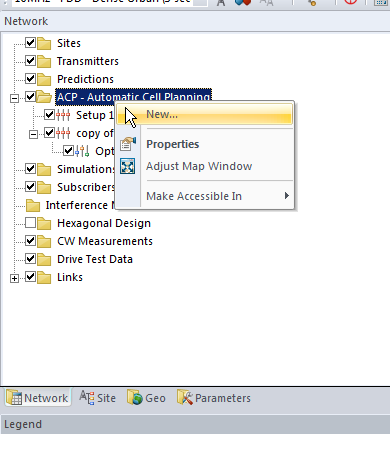
From the Network tab, right click on ACP Automatic Cell Planning and select New
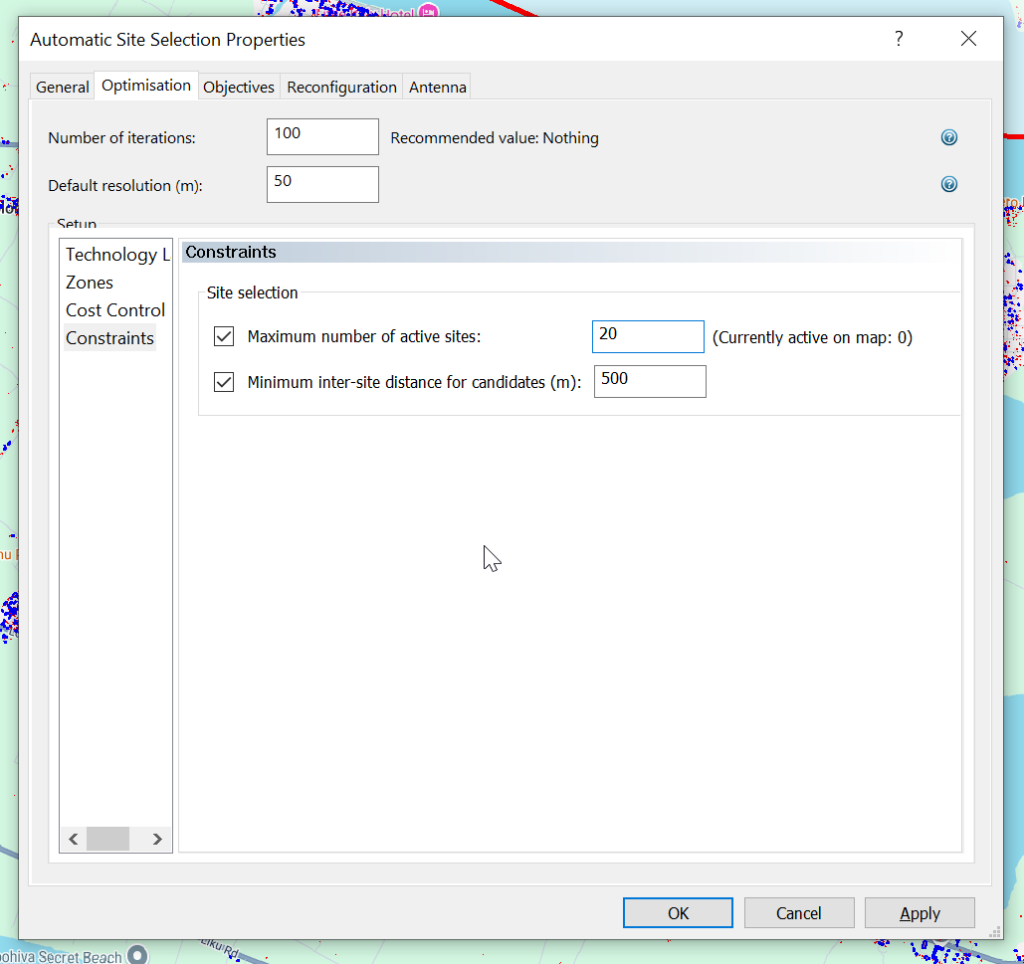
Optimization Tab
Before we can define all the specifics of what we’re looking to plan / improve, we need to set some limits on the software itself and tell it what we’re looking to improve.
The resolution defines how precise the results should be, and the iterations defines how many changes the software should run through.
The higher the number of iterations, the better the results, but it’s not linear – The improvement between 1000 iterations and 1,000,000,000 iterations is typically pretty minor, and this is because ACP works kind of a “getting warmer” philosophy, where it changes a value up or down, looks at the overall result and then if the result was better, changes the value again until it stops getting better.
As I’m working in a fairly small area I’m going to set 100 iterations and a 50m resolution.
In the optimization tab we can also set constraints, for example we’re looking at where to place cell sites in an area, and as far as Atoll is concerned if we just throw hundreds of sites at an area we’ll have pretty good results, but the economics of that doesn’t work, so we can set constraints, for example for site selection we may want to set the max number of cell sites. As we are importing ~5k candidate locations, we probably don’t want to build 5k cell sites 20m apart, so set this to be a reasonable number for your geography.
When using ACP for Optimization as we can see later on, we can also set cost constraints regarding the cost to make changes, but for now this is just going to pick best cell sites locations for us.
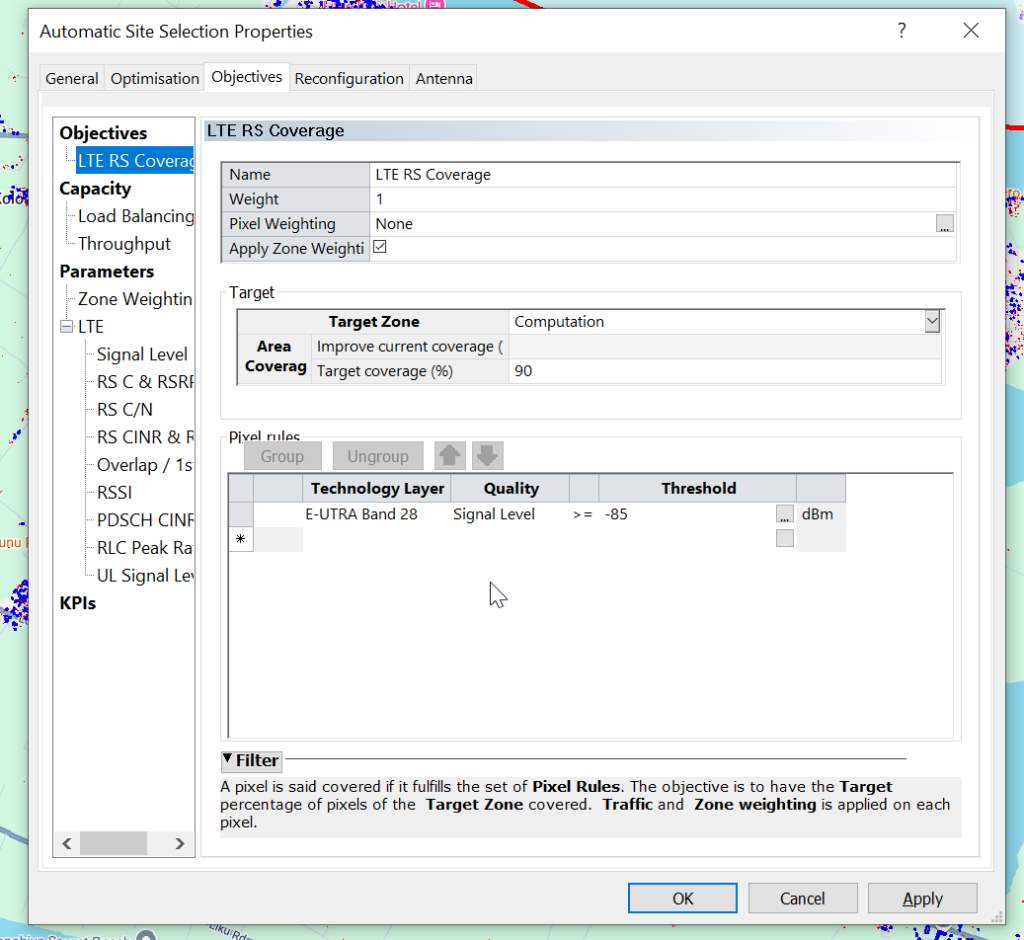
Objectives Tab
Next up we’ll need to setup Automatic Cell Plannings’ objectives.
For ACP to be an effective tool we need to define what we’re looking for in terms of success, you can’t just throw it some values and say “Make it better” – we need to define what parameters we’re looking to improve. We do this by setting Objectives.
Your objectives are going to be based on your needs and wants, but for this example we’re building greenfield networks, so want to offer coverage over an area, as well as good RSRP and RSRQ, so we will set the objectives to Coverage of 95% of the Computation Zone for this post, with a secondary objective of increasing RSRP and RSRQ.
But today I’m modeling for coverage, so let’s set that:
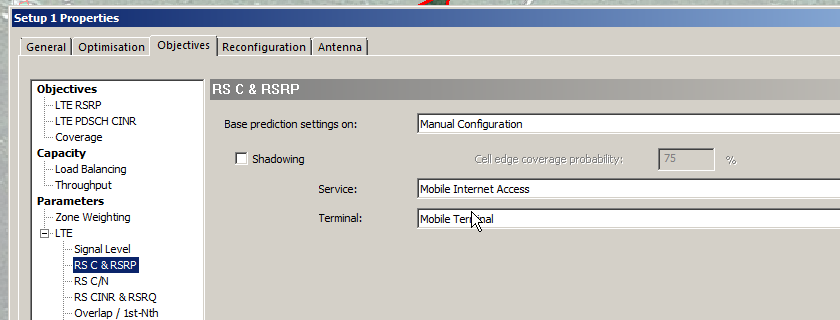
As we’re planning for LTE we need to set the UE parameters, as I’m planning for a mobile network, I’ll need to set the service type and terminal.
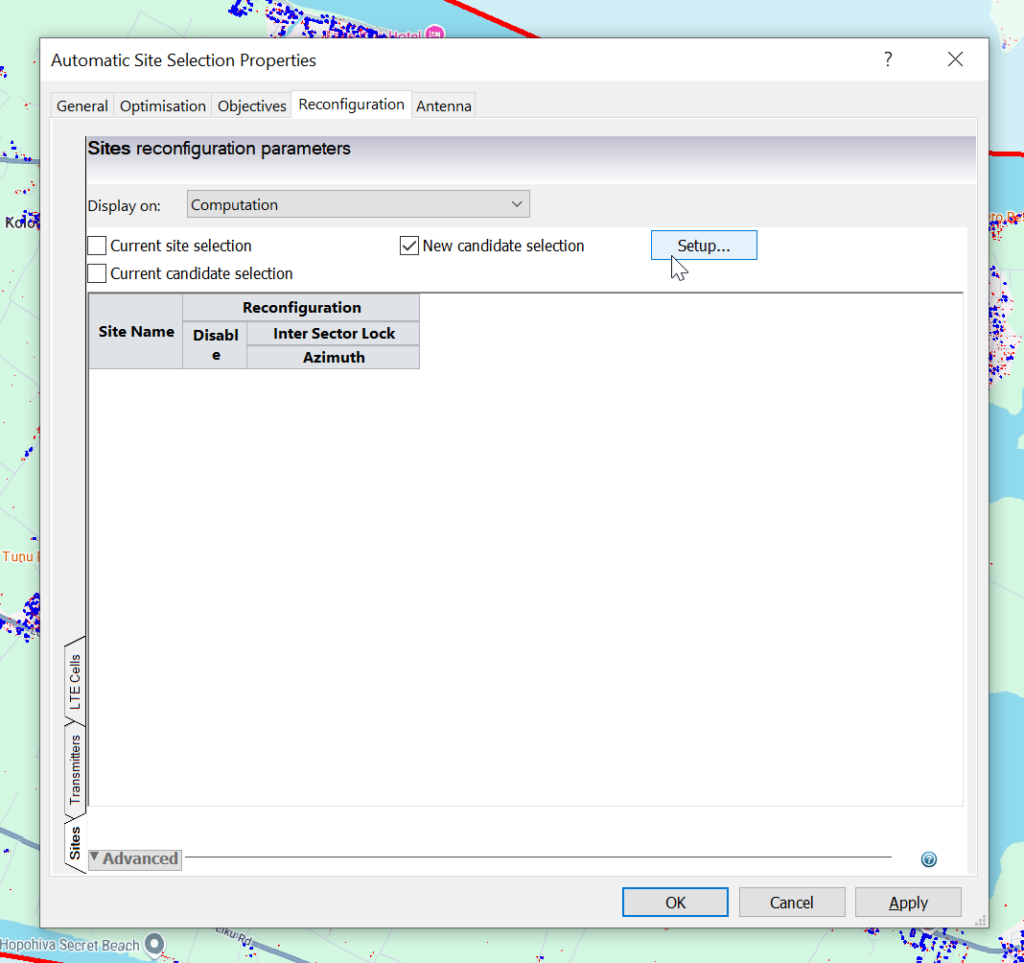
Reconfiguration
Now we’ve defined the Objectives, it’s now time to define what values ACP can mess with to try and achieve these objectives, for some ACP runs you may be adjusting tilts or azimuths, swapping out antennas, etc, but today we’re looking for where we can put cell sites to be the most effective to serve our target area.
Now we import our candidate list. This might be a list of potential towers you can use, or in my case, for something greenfield, I’m just importing a list of points on a map every X meters to find the best locations to place towers.
From the “Reconfiguration”, we’ll select “Setup” to add the sites we want to evalute.
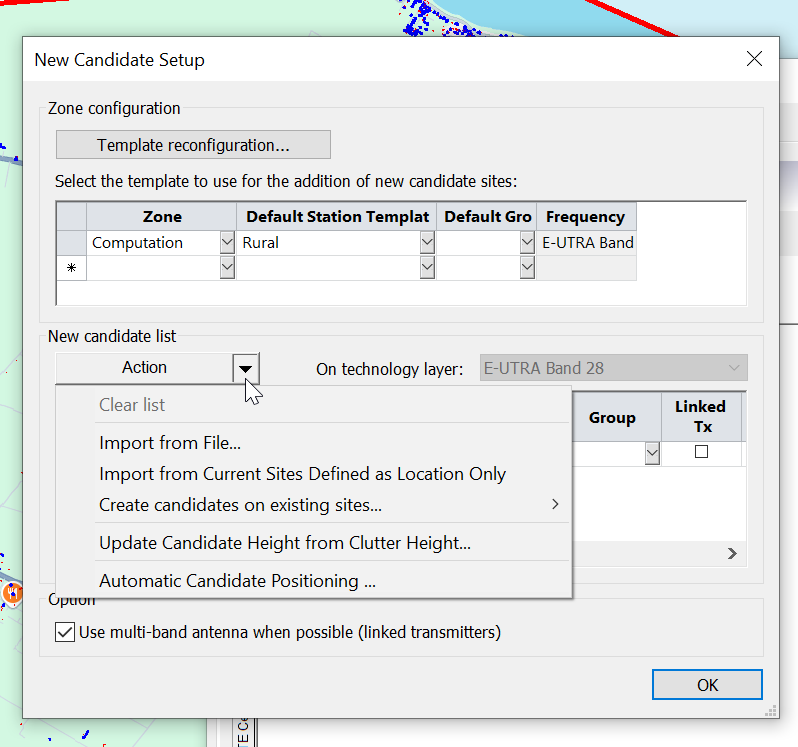
Atoll has “Automatic Candidate Positioning” which allows it to generate pins on the map, but I’ve not had any luck with it, instead I’m importing a list of candidates I’ve generated via a little Python script, so I’ll select “Import from File”.
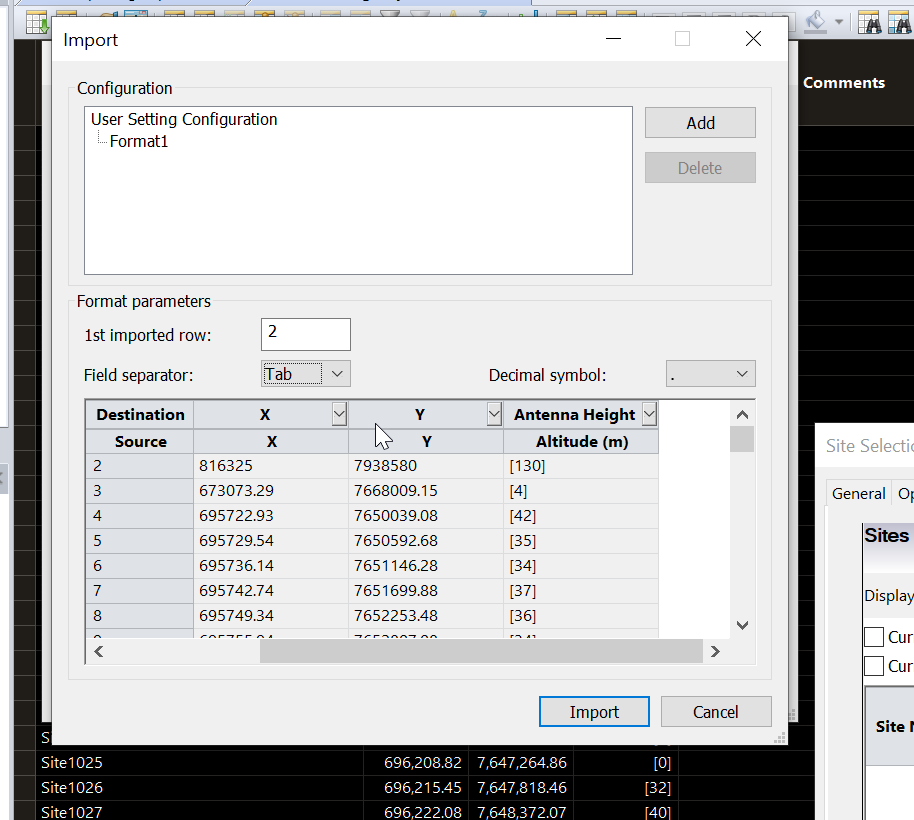
Pick my file and set the parameters for importing the data like so.
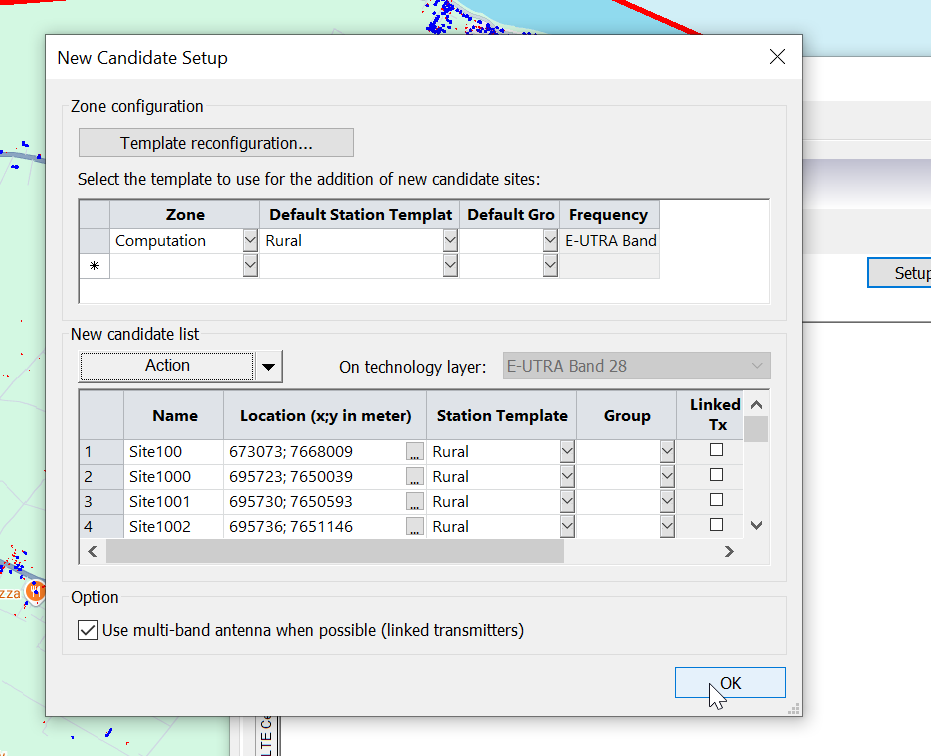
Now we’ve got candidates for cell sites defined, we set the station template to populate and then we’re good to go.
Running ACP
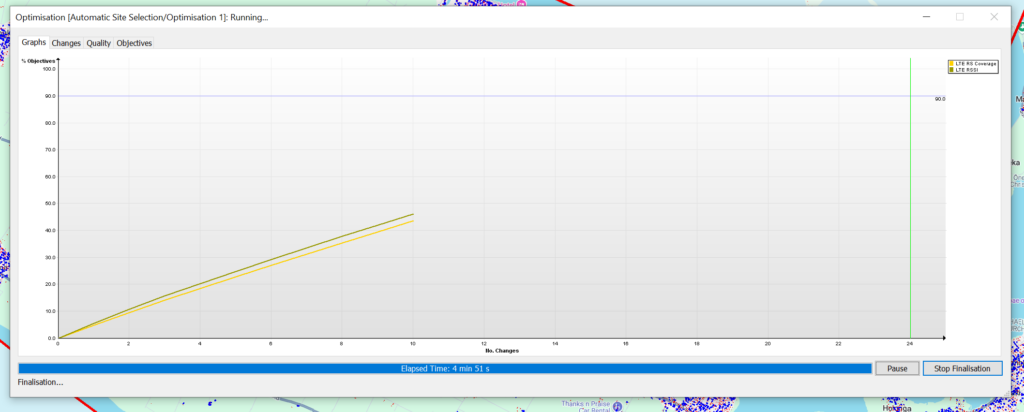
Once you’ve tweaked all your ACP values as required, we can run the ACP job,
As ACP runs you’ll see a graph showing the objectives and the levels it needs to reach to satisfy them, this step can take a super dooper long time – Especially if your computation zone is large or your number of candidates is large.
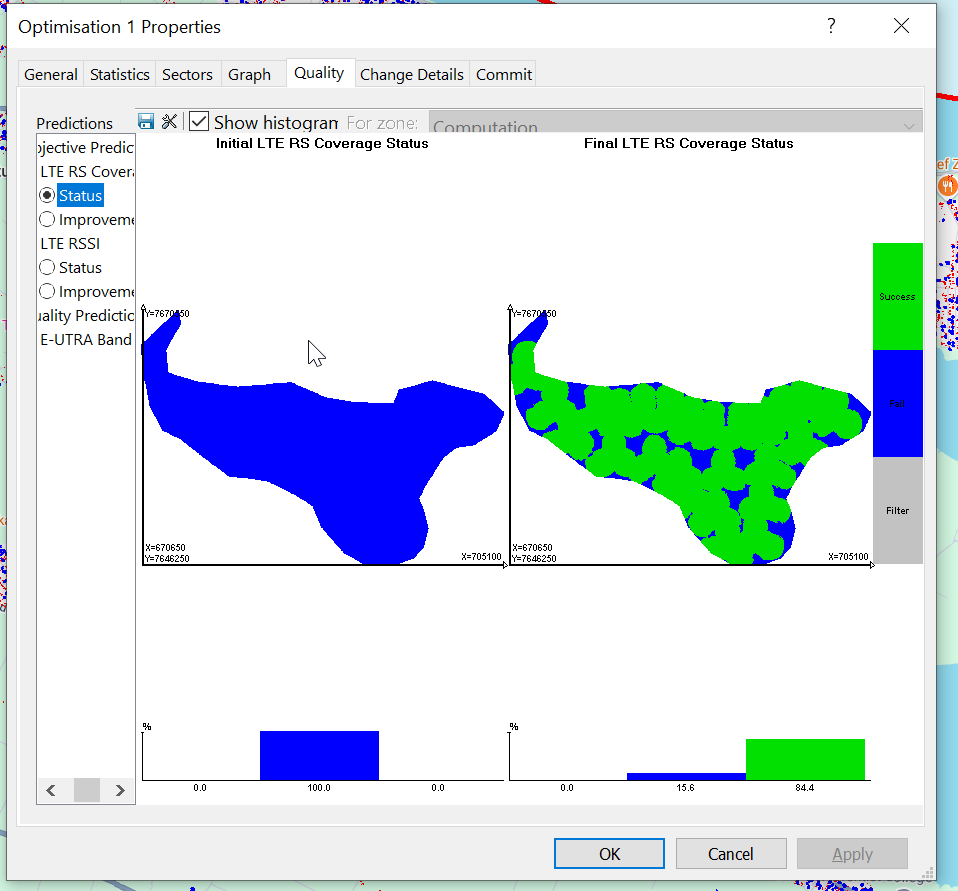
But eventually we’ll be a lot older and wearier, but ACP will have completed, and we can checkout the Optimization it’s created.
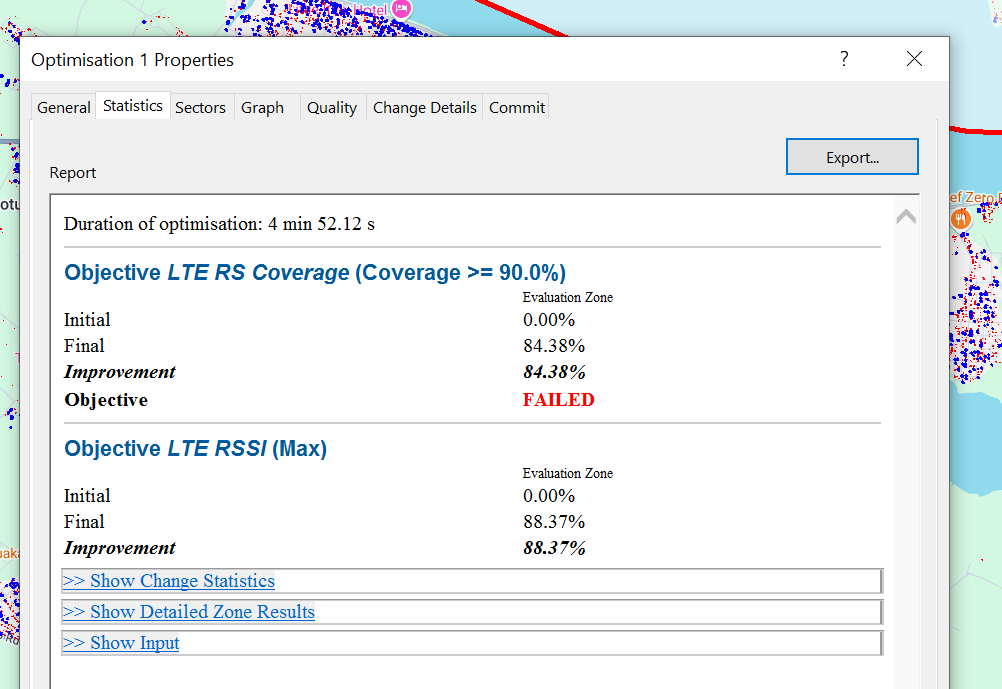
In my case the objectives failed to be met, but that’s OK for me,
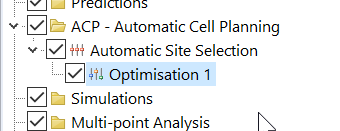
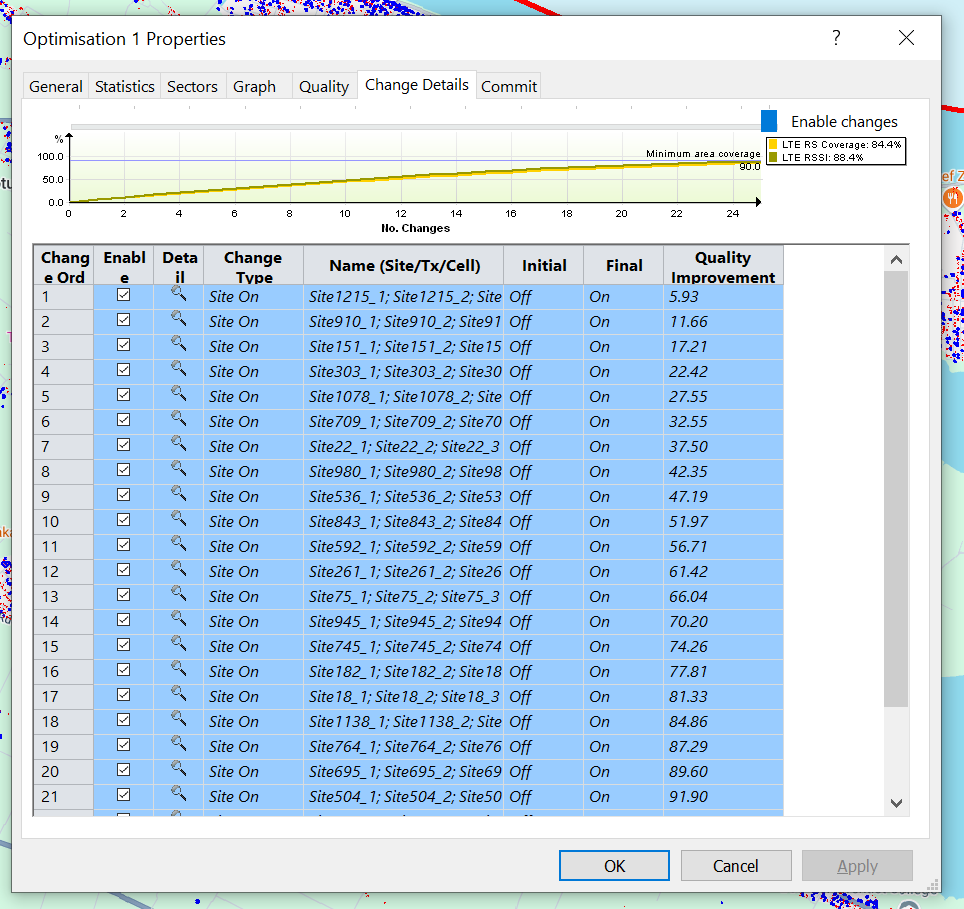
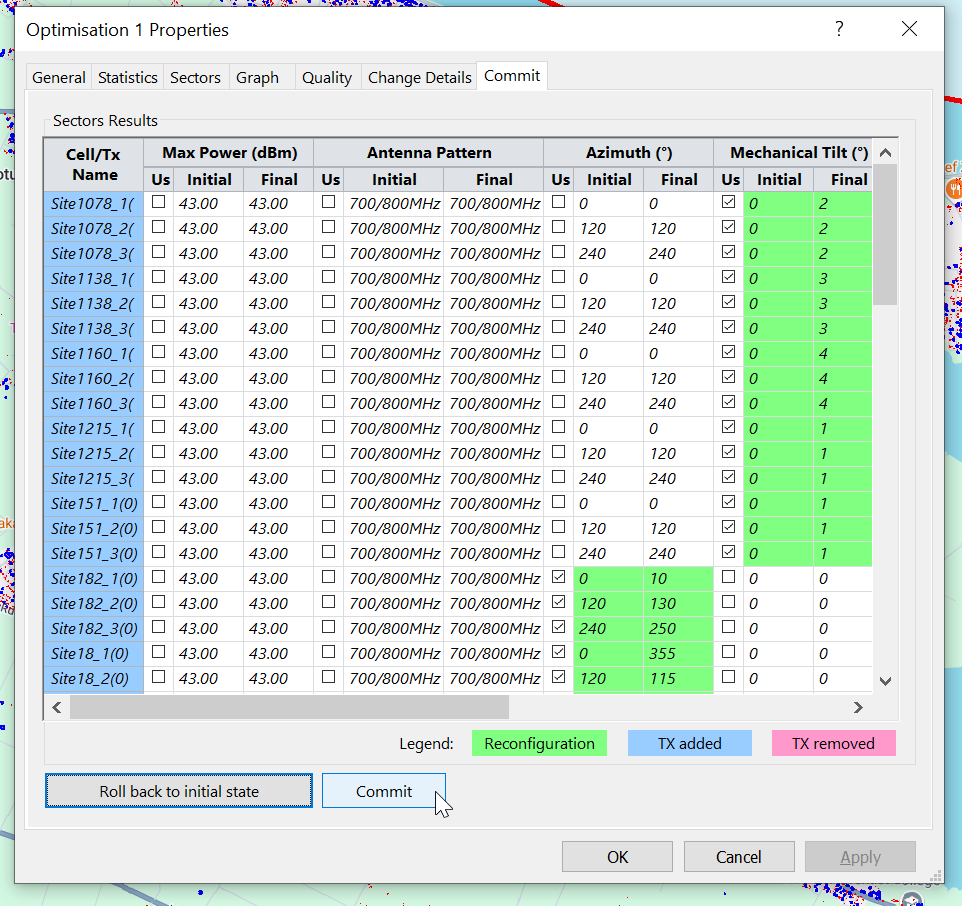
One it’s completed the Changes tab outlines the recommended changes, and the Objectives outlines how this has performed against the criteria we outlined at the start, and if we’re happy with the result, we can Commit the changes to put them on the map from the commit tab.
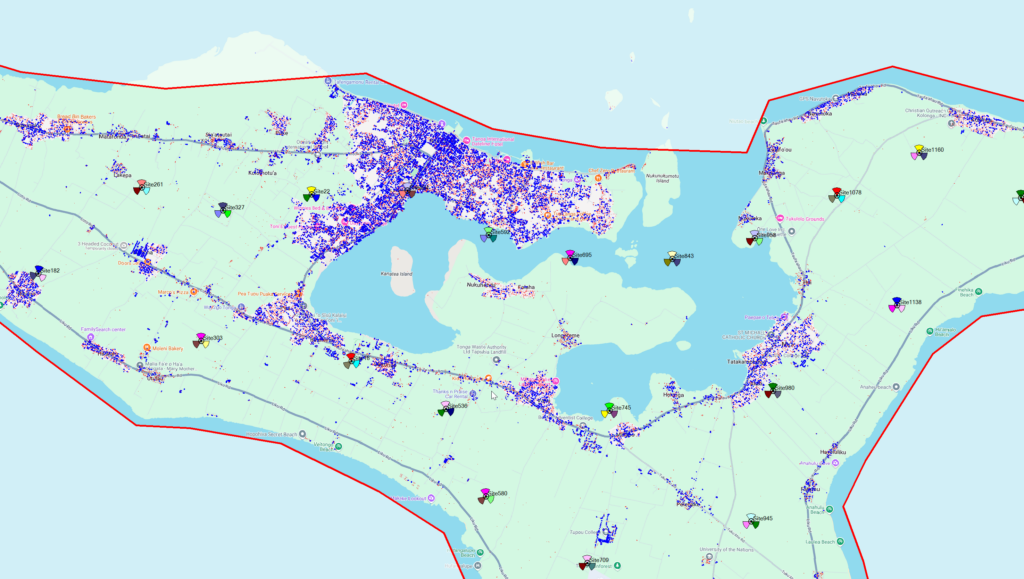
With that done I weed out the sites in impractical locations, the the ones in the sea…
Now we’ve got the sites plugged in, the next thing we’ll start doing is optimizing them.
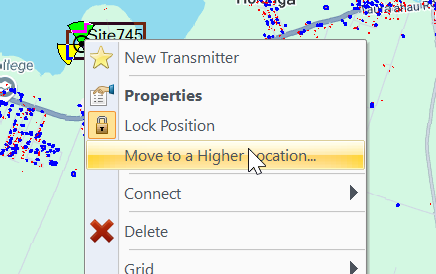
When we’re dealing with greenfield builds like we are today, the “Move to highest location with X Meters” function is super useful. If you’ve got a high point on a property, we want to build our tower on the highest point, so the tower is moved to the highest point.
One thing to note is this just plans our grid. It won’t adjust azimuths, downtilts, etc, in one operation. We need to use another ACP operation to achieve that, and that’s the content of a different post!
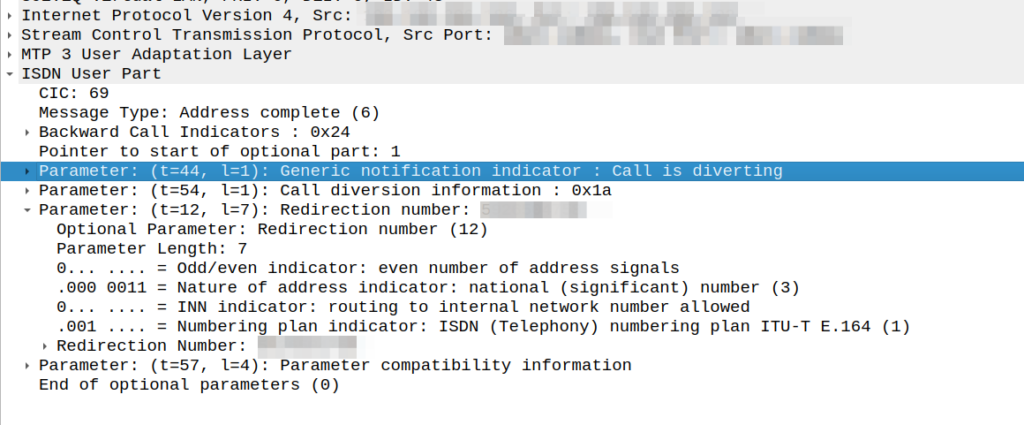
Had an interesting fault come across my desk the other day; calls were failing when the called party (an SSP we talk to via SS7/ISUP) had an exchange based call forward in place.
We’re a SIP based network, but we do talk some SS7/ISUP on the edges, and it was important that we handled this correctly.
I could see in the Address Complete Message (ACM) sent back to our network that there was redirection information here:
We would see the B party SSP release the call as soon as it sent this.
This made me wonder if we, as the originating network, were supposed to redirect to the new B party and send a new Initial Address Message?
After a lot of digging in the ITU Q.7xx docs (I’m not where near as fast at finding information in specs written prior to my birth, than I am with the 3GPP specs) I found my answer – These headers are informational only, the B party SSP is meant to re-target the message, and send us an Alerting or Answer message when it’s done so.
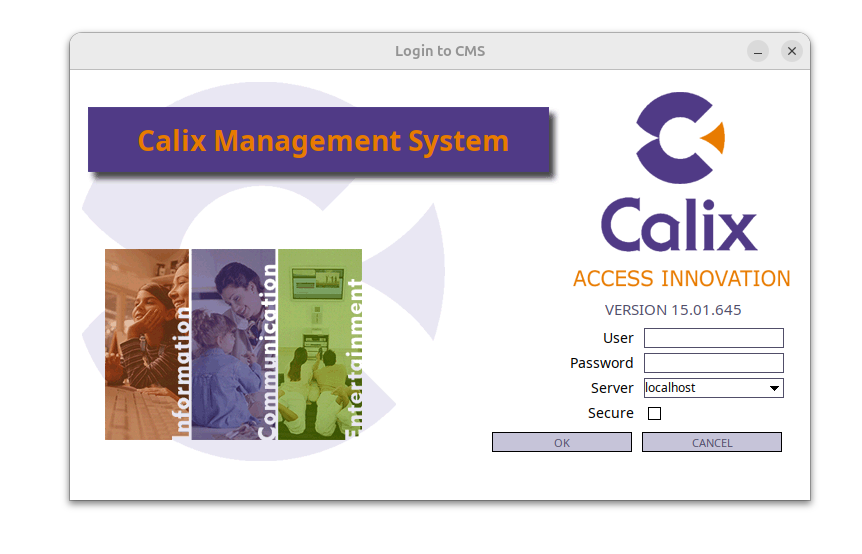
Recently one of our customers who’s got a large number of Calix E7 ONTs needed some help to automate some of the network management tasks to do with the CPEs.
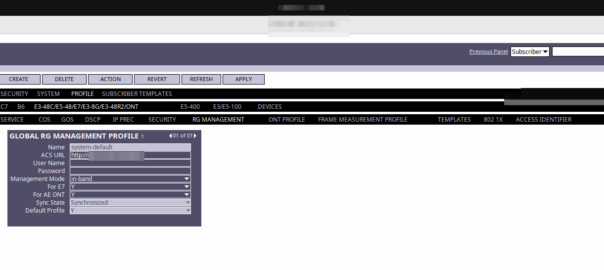
We’d setup an TR-069 Auto Configuration Server (ACS) for the Calix RGs (The modems) so that we could manage the config parameters on the devices.
Setup was suprisingly easy, after installing some god-awful 90’s Java stuff to access Calix’s “CMS” we pointed everything at our ACS (Per screenshot below) and presto, a few thousand CPEs were there ready to be centrally managed.
CAMEL is primarily focused on charging for Voice & SMS services, as data generally uses Diameter, so it’s voice and SMS we’ll focus on.
CAMEL is spoken between the MSC (gsmSSF) and the OCS (gsmSCF).
Basic Call State Model
CAMEL is closely related to the Intelligent Network stuff on the 1980s, and steals a lot of it’s ideas from there, unfortunately if you’re to read the CAMEL standard it also implies you were involved in IN stuff and had been born at that point, alas I was neither.
So the key to understanding CAMEL is the Basic Call State Model (BCSM) which is a model of all the different states a call can be in, such as ringing, answered, abandoned, call failed, etc, etc.
Over CAMEL, our OCS can be told by the MSC when a certain event happens; the MSC can tell the OCS, that the call has changed state. For example a BCSM event might indicate the call has hung up, is ringing, cancelled, etc.
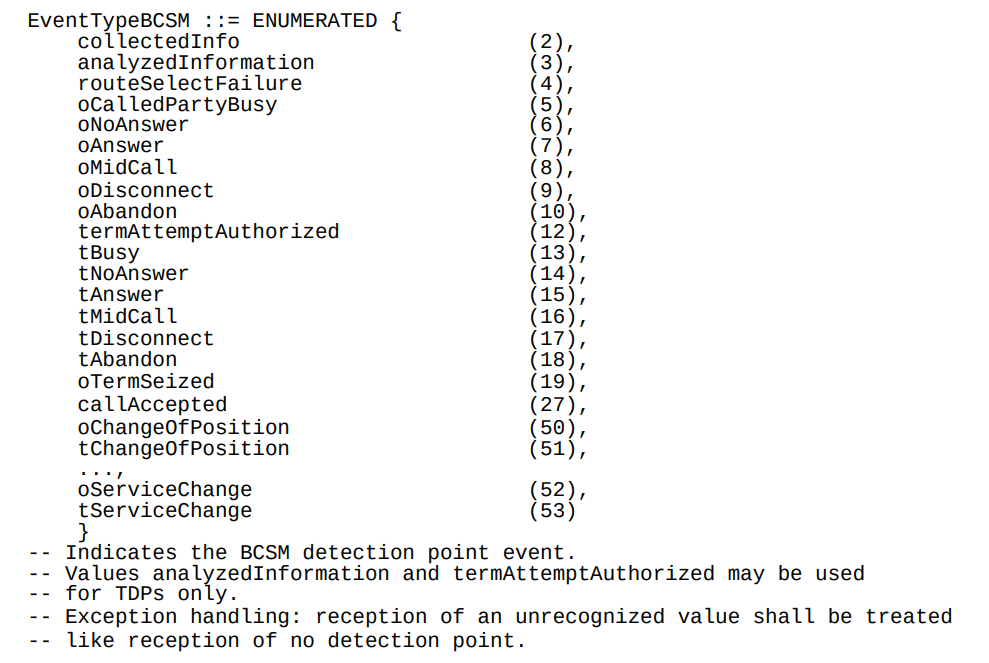
Below is the list of all the valid BCSM states:
List of BCSM states for events
Basic MO Call with CAMEL
Our subscriber makes an outbound call.
Based on the data the MSC has in it from the HLR, it knows that we should use CAMEL for this call, and it has the SCCP Address of the OCS (gsmSCF) it needs to send the CAMEL messages to.
So the MSC sends an InitialDP message to the OCS (via it’s Global Title Address) to Authorize the call that the user is trying to make.
This is like any other Authorization step for an OCS, which allows the OCS to authorize the call by checking the subscriber is valid, check if they’re allowed to call that destination and they’ve got the balance to do so, etc.
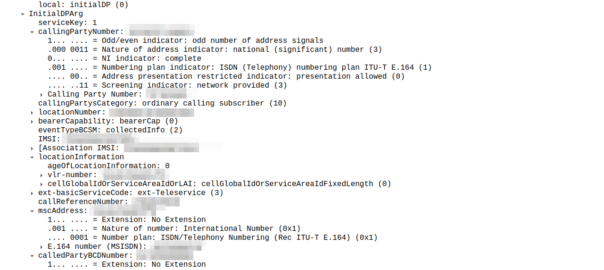
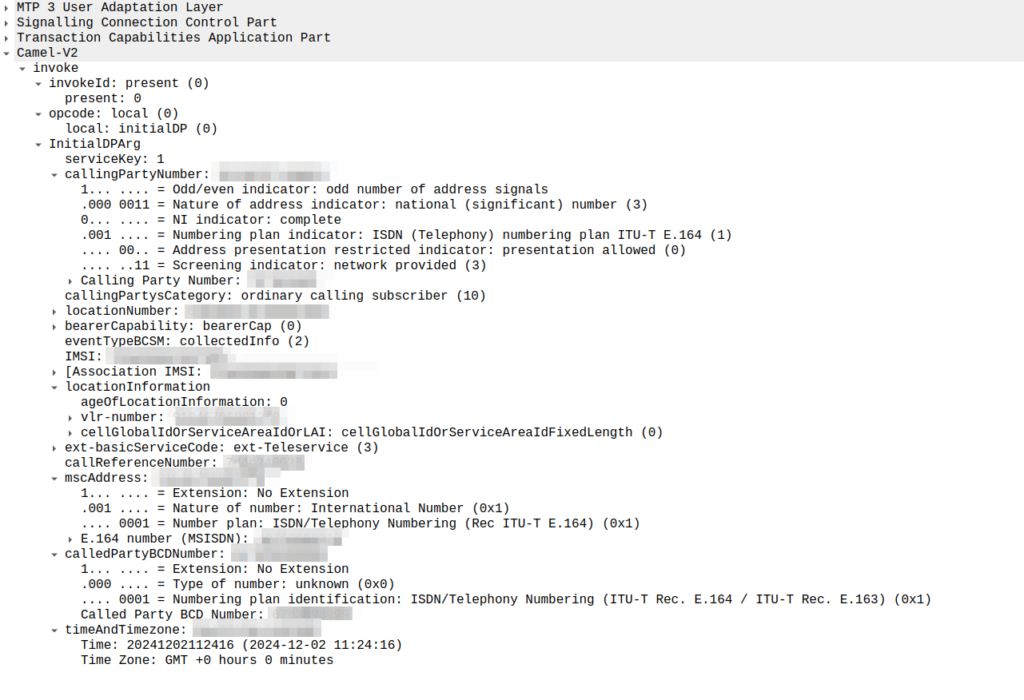
initialDP message from an MSC to an OCS
The initialDP (Initial Detection Point) is telling our OCS all about the call event that’s being requested, who’s calling, what number they’ve dialed, where they are in the network (of note especially if they’re roaming), etc, etc.
Generally the OCS also uses this message as a chance to subscribe to BCSM Events using RequestReportBCSMEventArg so the OCS will get notified by the MSC when the state of the call changes. This means the MSC will tell us when the state of the call changes; events like the call getting answered, disconnected, etc. This is critical so we know when the call gets answered and hung-up, so we can charge correctly.
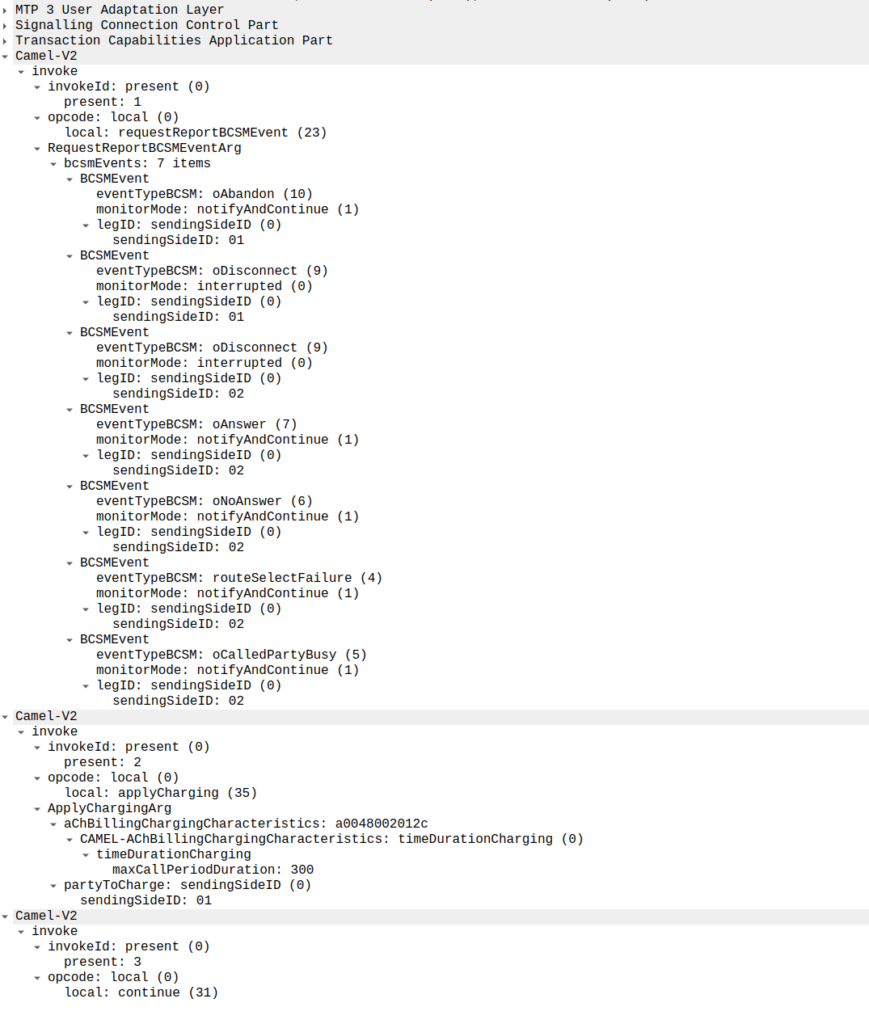
In the below example, as well as sending the Continue and RequestReportBCSMEventArg the OCS is also setting the ChargingArgs for this call, so the MSC knows who to charge (the caller) set via sendingSide and that the MSC must send an Apply Charging Report (ACR) messages every 300 units (1 unit = 100 ms, so a value of 300 = 300 x 100 milliseconds = 30 seconds) so the OCS keeps track of what’s going on.
continue sent by the OCS to the MSC, also including reportBCSMEvent and applyCharging messages
Or in a slightly less appropriate analogy but easier to understand for SIP folks, the InitialDP is sent for INVITE and the 180 RINGING is sent once the continue message is received.
Call is Answered
So at this stage our call can start to ring.
As we’ve subscribed to BCSM events in our last message, the MSC is going to tell us when the call gets answered or the call times out, is abandoned or the sun burns out.
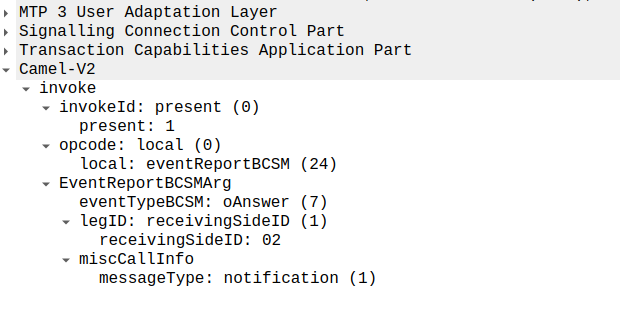
The MSC provides this info a eventReportBCSM, which is very simple and just tells us the event that’s been triggered, in the example below, the call was answered.
eventReportBCSM from MSC to OCS
These eventReportBCSM are informational from the MSC to the OCS, so the OCS doesn’t need to send anything back, but the OCS does need to mark the call as answered so it can start timing the call.
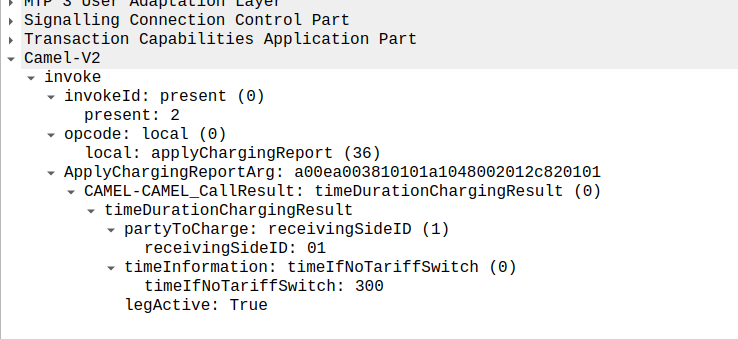
At this stage, the call is connected and our two parties are talking, but our MSC has been told it needs to send us applyChargingReports every 30 seconds (due to the value of 300 in maxCallPeriodDuration) after the call was connected, so the MSC sends the OCS it’s first applyChargingReport 30 seconds after the call was answered:
applyChargingReport sent by the MSC to the OCS every reporting period
We can calculate the duration of the call so far based on the time of the eventReportBCSM, then the OCS must make a decision of if it should allow the call to continue or not.
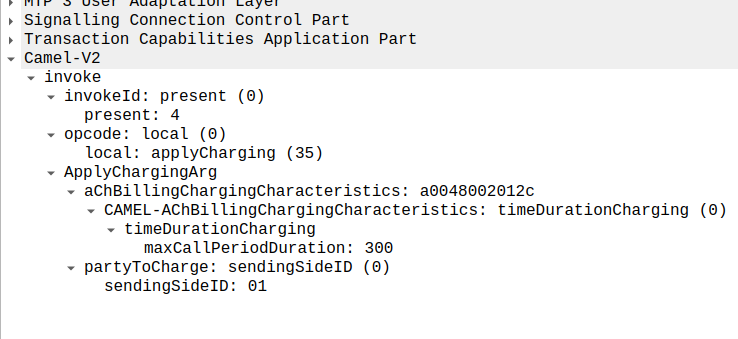
For simplicity’s sake, let’s imagine we’re still got a balance in the OCS and the OCS wants the call to continue, the OCS send back an applyCharging message to the MSC in response, and includes the current allowed maxCallPeriodDuration, keeping in mind the value is x100 and in nanoseconds (so this is 30 seconds).
applyCharging from the OCS back to the MSC
Perfect, our call is good to go for another 30 more seconds, son in 30 seconds we’ll get another ACR messages from MSC to the OCS to keep it abreast of what’s going on.
Now one of two things is going to happen, either subscriber is going to burn through all of their minutes, and get their call cutoff, or the call will end while they’ve still got balance, let’s look at both scenarios.
Normal Hangup Scenario
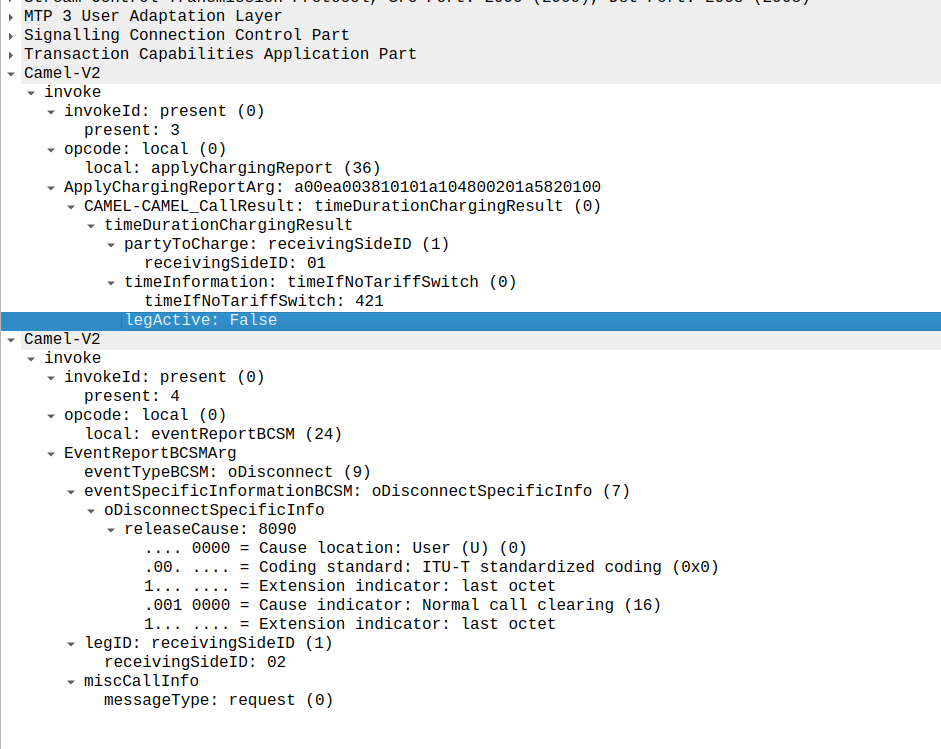
When the call ends, we get an applyChargingReport from the MSC to the OCS.
As we’ve subscribed to reportBCSMEvent we get both the applyChargingReport with legActive: False` so we know the call has hungup, and we’ve got an event report to tell us more about the event, in this case a hangup from the Originating Side.
reportBCSMEvent and applyChargingReport Sent by the MSC to the OCS to indicate the call has ended, note the legActive flag is now false
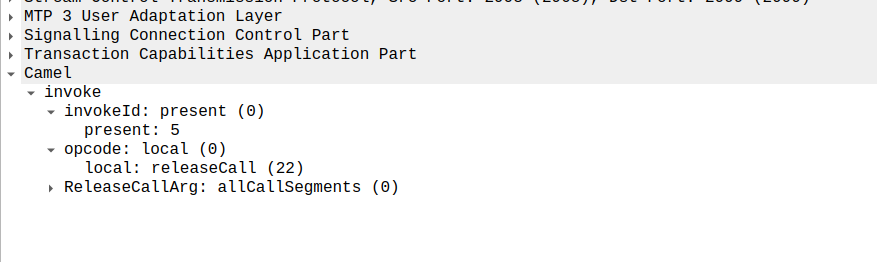
Lastly the OCS confirms by sending a releaseCall to the MSC, to indicate all legs should now terminate.
releaseCall Sent by OCS to MSC at the very end
So that’s it!
Obviously there are other flows, such as running out of balance mid-call, rejecting a call, SMS and PBX / VPN services that rely on CAMEL, but hopefully you now understand the basics of how CAMEL based charging looks and works.
If you’re looking for a CAMEL capable OCS or a CAMEL to Diameter or API gateway, get in touch!
Ask anyone in the industry and they’ll tell you that GTPv2-C (aka GTP-C) uses port 2123, and they’re right, kinda.
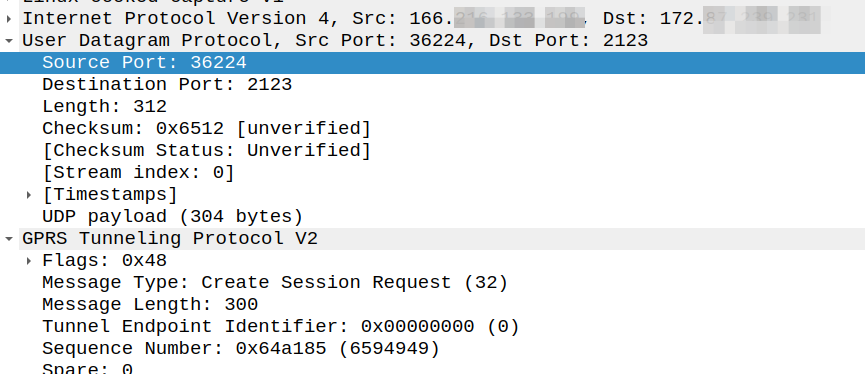
Per TS 129.274 the Create Session Request should be sent to port 2123, but the source port can be any port:
The UDP Source Port for a GTPv2 Initial message is a locally allocated port number at the sending GTP entity.
So this means that while the Destination Port is 2123, the source port is not always 2123.
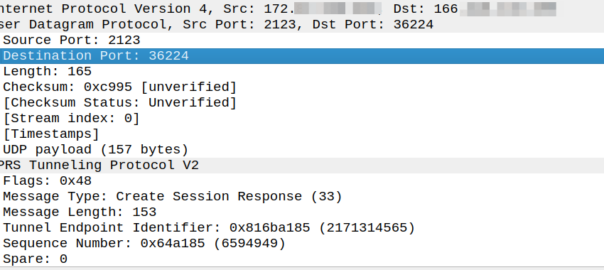
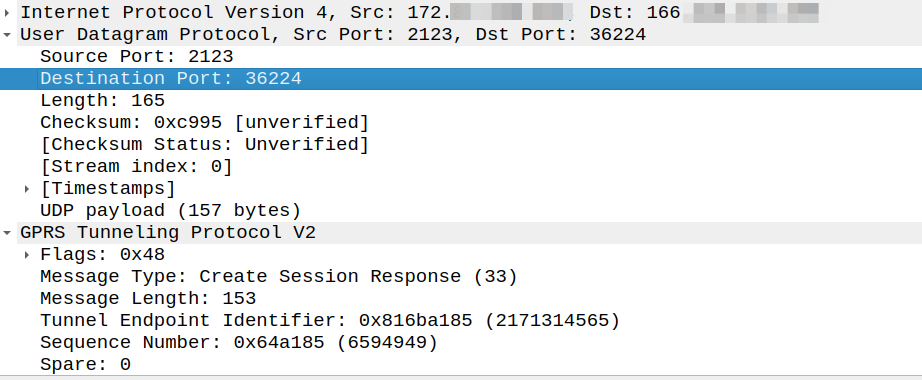
So what about a response to this? Our Create Session Response must go where?
Create Session request coming from 166.x.y.z from a random port 36225 Going to the PGW on 172.x.y.z port 2123
The response goes to the same port the request came on, so for the example above, as the source port was 36225, the Create Session Response must be sent to port 36225.
Because:
The UDP Destination Port value of a GTPv2 Triggered message and for a Triggered Reply message shall be the value of the UDP Source Port of the corresponding message to which this GTPv2 entity is replying, except in the case of the SGSN pool scenario.
But that’s where the association ends.
So if our PGW wants to send a Create Bearer Request to the SGW, that’s an initial message, so must go to port 2123, even if the Create Session Request came from a random different port.
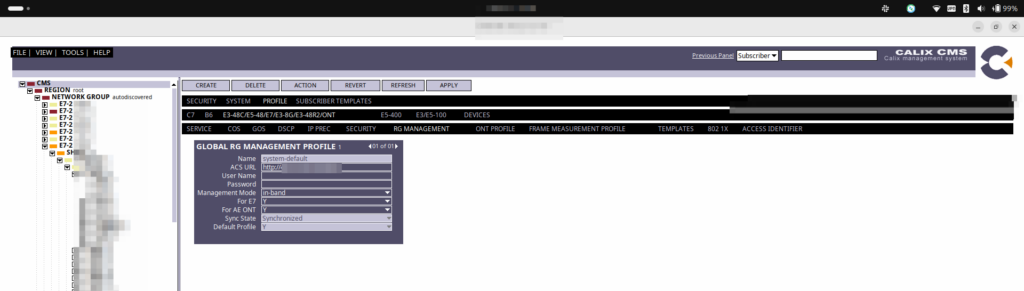
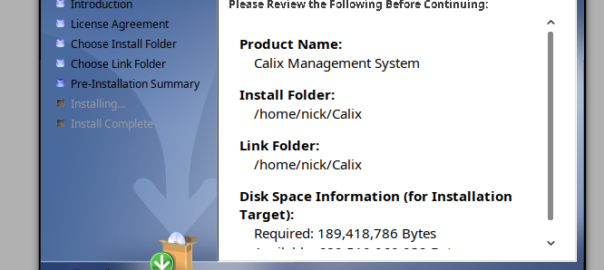
Ah, another post in my “how to make software work that was made with Java in the 1990s” post, except Calix last updated this software in 2022 – make of that what you will…
This time is Calix Management System (CMS), the Java app for managing equipment in exchanges / COs from Calix.
What is included in the Charging Rule on Gx ultimately turns into a Create Bearer Request on GTPv2-C.
But the mapping it’s always obvious, today I got stuck on the difference between a Single remote port type, and a single local port type, thinking that the Packet Filter Direction in the TFT controlled this – It doesn’t – It’s controlled by the order of your Traffic Flow Template rule.
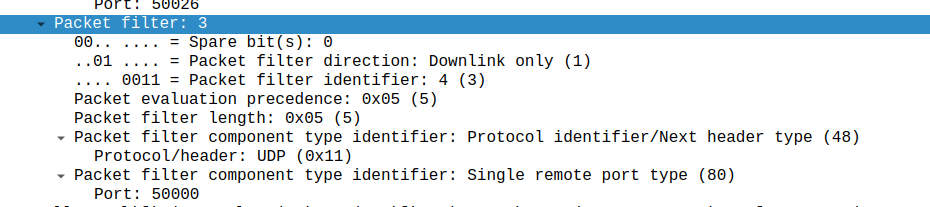
Input TFT:
"permit out 17 from any 50000 to any"
Leads to Packet filter component type identifier: Single remote port type
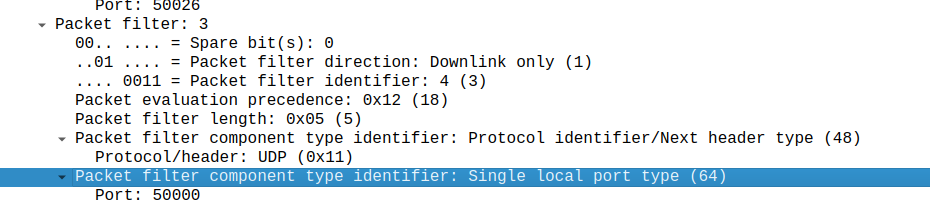
Whereas a TFT of:
permit out 17 from any to any 50000
Leads to Packet filter component type identifier: Single local port type (64)
As summer reaches full swing in Australia and the level of effort I put into blog posts wains, here’s a lost of books I’m to-read or have read this year.
I can’t imagine a telecom book club being super popular, but if you’ve got any recommendations for good telecom related reads, I’d love to hear them!
The End of Telecoms History – William Webb (Read)
I read this this year, Webb is one of those folks who’s paycheck doesn’t come from shilling hardware, and he’s been pretty good at making accurate predictions and soothsaying, even when what he says upsets some.
The launch of 5G pretty much played out exactly how one of his other books (The 5G Myth) predicted, and the premise of The End of Telecoms History is that if we look at the data which suggest that bandwidth growth will not continue unabated forever, what does that mean?
I’ve a feeling there are a telecom execs quietly reading this book (while making sure that no sees them reading it) and planning for a potential future in a world of enough bandwidth to satisfy demand, and how this would impact their bottom lines and overall business model, even if outwardly everyone still claims the growth will continue forever.
The Iron Wire: A novel of the Adelaide to Darwin telegraph line – Garry Kilworth (Read)
A fun imagined romp about adventures in the bush while connecting a nation in the 18th century, the story is inspired by the real world events but are fictional, it’s a fun way to explore the topic and add bushrangers into the mix.
Rogers v. Rogers: The Battle for Control of Canada’s Telecom Empire – Alexandra Posadzki (Read)
Just finished this; I’ve worked with a lot of operators in the past, both big some small (the best ones are small), and it’s fascinating to understand at a board level how things get done in telecom giants, even if the Rogers’ family aren’t the best example of how to do this…
Chip War: The Fight for the World’s Most Critical Technology – Chris Miller (Read)
Without integrated circuits the telecom industry is back to relays and electromagnetically switching traffic (not that I’m against this).
Miller’s book outlines how we got to our current situation, and how the products coming out of TSMC and SMIC will shape the future of tech at a fundamental level.
How the World Was One – Arthur C Clarke (To Read)
Famed science fiction writer Arthur C Clarke had a penchant for scuba diving and communications (can relate) hence his interest in submarine telephony.
I read “Voice Across the Sea” a few years ago (on an actual paper based book no less!) but this is freely available as an eBook and I’m looking forward to reading it.
Introducing Elixir – Simon St. Laurent & J. David Eisenberg (Reading)
The dev team at Omnitouch are all about Elixir, and being an old dinosaur I figured I should at least learn the basics!
I’m still working my way through the book, having a folder of examples typed out from the book (I can’t learn through copy / paste!), enjoying it so far, even if I’m slower than I’d like.
Adventures in Innovation: Inside the Rise and Fall of Nortel – John Tyson
My first job was with Nortel, so I’ve got a bit of a soft spot of the former Canadian telecom behemoth, and never felt I’d had a satisfactory explanation as to where it all went wrong. I got this book expecting a bit more insight into the fall part, but this book gave an interesting account as to the design of things I’d never put much thought into before.
The Real Internet Architecture: Past, Present, and Future Evolution – Zave, Pamela;Rexford, Jennifer; (To Read)
This came from a recommendation on Twitter, I know almost nothing about it other than that, but I’m keen to dig into this.
Burn Book: A Tech Love Story – Kara Swisher (Read)
A fun insight into the life and times of the big tech.
The 6G Manifesto – William Webb
There’s a Simpsons’ scene where Lisa is buying an Al Gore book named “Sane Planning, Sensible Tomorrow” and says “I hope it’s as exciting as his other book, ‘Rational Thinking, Reasonable Future'”.
I can’t help but feel Webb’s books are kinda like this (in a good way).
Realism is so important; staying grounded in reality is critical. Operators who go chasing fairy tales of driving higher ARPUs with wacky ideas with no business case or demand from end customers (and generally pushed by vendors, rather than operators) will struggle to remain viable in the future if they pour all their cash into things that won’t see a return, so I’m looking forward to reading some sane ideas as to how to approach the unnecessary Gs.
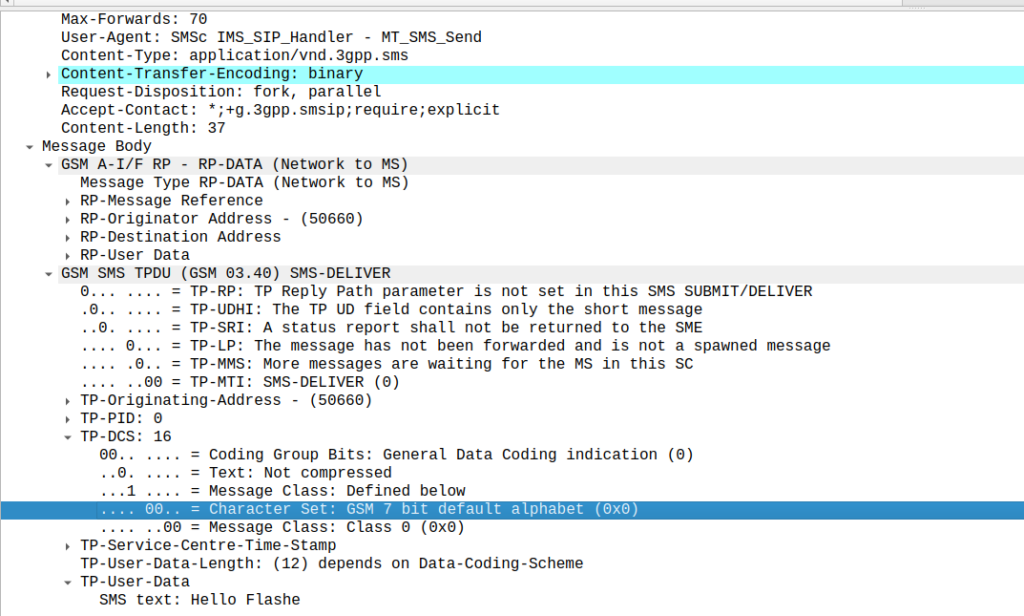
Stumbled across these the other day, while messing around with some values on our SMSc.
Setting the Data Coding Scheme to 16 with GSM7 encoding flags the SMS as “Flash message”, which means it pops up on the screen of the phone on top of whatever the user is doing.
While reading a quality telecom blog bam! There’s the flash SMS popping over whatever I was reading.
Oddly while there’s plenty of info online about Flash SMS, it does not appear in the 3GPP specifications for SMS.
Turns out they still work, move over RCS and A2P, it’s all about Flash messages!
There’s no real secret to this other than to set the Data Coding Scheme to 16, which is GSM7 with Flash class set. That’s it.
Obviously to take advantage of this you’d need to be a network operator, or have access to the network you wish to deliver to. Recently more A2P providers are filtering non vanilla SMS traffic to filter out stuff like SMS OTA message or SIM specific messages, so there’s a good chance this may not work through A2P providers.