I recently fell in love with the Prometheus + Grafana combo, and I’m including it in as much of my workflow as possible, so today we’ll be integrating this with another favorite – Kamailio.
Why would we want to integrate Kamailio into Prometheus + Grafana? Observability, monitoring, alerting, cool dashboards to make it look like you’re doing complicated stuff, this duo have it all!
I’m going to assume some level of familiarity with Prometheus here, and at least a basic level of understanding of Kamailio (if you’ve never worked with Kamailio before, check out my Kamailio 101 Series, then jump back here).
So what will we achieve today?
We’ll start with the simple SIP Registrar in Kamailio from this post, and we’ll add on the xhttp_prom module, and use it to expose some stats on the rate of requests, and responses sent to those requests.
So to get started we’ll need to load some extra modules, xhttp_prom module requires xhttp (If you’d like to learn the basics of xhttp there’s also a Kamailio Bytes – xHTTP Module post covering the basics) so we’ll load both.
xHTTP also has some extra requirements to load, so in the top of our config we’ll explicitly specify what ports we want to bind to, and set two parameters that control how Kamailio handles HTTP requests (otherwise you’ll not get responses for HTTP GET requests).
listen=tcp:0.0.0.0:9090
listen=tcp:0.0.0.0:5060
listen=udp:0.0.0.0:5060

http_reply_parse=yes
tcp_accept_no_cl=yes
Then where you load all your modules we’ll load xhttp and xhttp_prom, and set the basic parameters:
loadmodule "xhttp.so"
loadmodule "xhttp_prom.so"

# Define two counters and a gauge
modparam("xhttp_prom", "xhttp_prom_stats", "all")
By setting xhttp_prom module to expose all stats, this exposes all of Kamailio’s internal stats as counters to Prometheus – This means we don’t need to define all our own counters / histograms / gauges, instead we can use the built in ones from Kamailio. Of course we can define our own custom ones, but we’ll do that in our next post.
Lastly we’ll need to add an event route to handle HTTP requests to the /metrics URL:
event_route[xhttp:request] {
	xlog("Got a request!");
	xlog("$ru");
	$var(xhttp_prom_root) = $(hu{s.substr,0,8});
	if ($var(xhttp_prom_root) == "/metrics") {
			xlog("Called metrics");
			prom_dispatch();
			xlog("prom_dispatch() called");
			return;
	} else
		xhttp_reply("200", "OK", "text/html",
        		"<html><body>Wrong URL $hu</body></html>");
}
Restart, and browse to the IP of your Kamailio instance (mine is 10.01.23) port 9090 /metrics and you’ll get something like this:
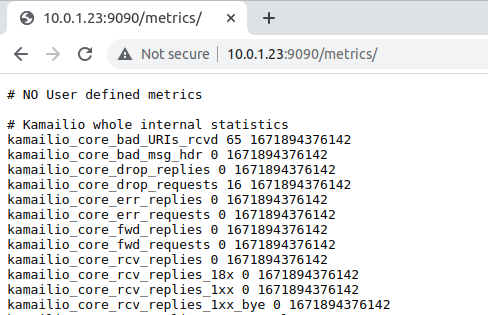
That my friends, is the sort of data that Prometheus gobbles up, so let’s point Prometheus at it and see what data we get back.
Over on my Prometheus server I’ve edited /etc/prometheus/prometheus.yml to target our new Prometheus endpoint.
  - job_name: "kamailo"
    static_configs:
      - targets: ["10.0.1.23:9090"]
    honor_timestamps: false
So how can we see this data? Well first off if we log into Prometheus we can see the data flowing in:
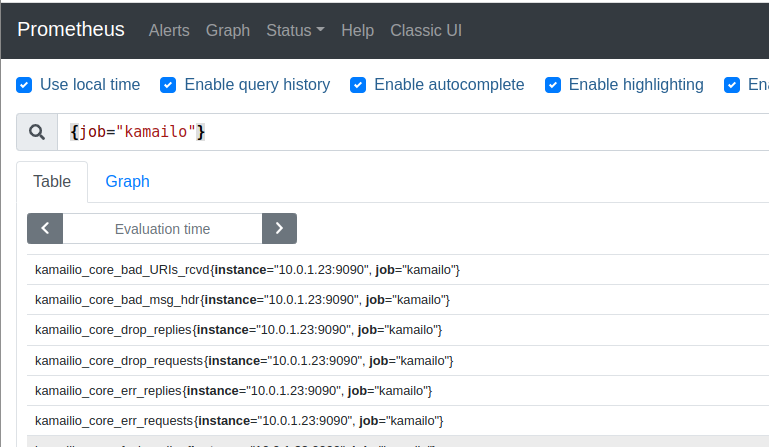
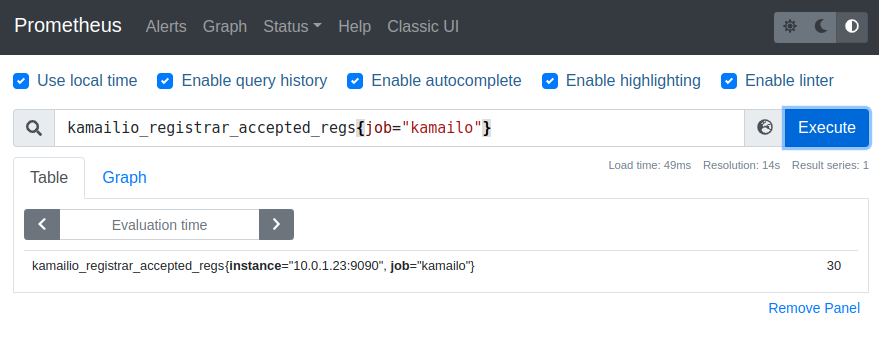
If we throw some SIP REGISTER traffic at our Kamailio instance and check on the kamailio_registrar_accepted_regs stat we can see our registrations.
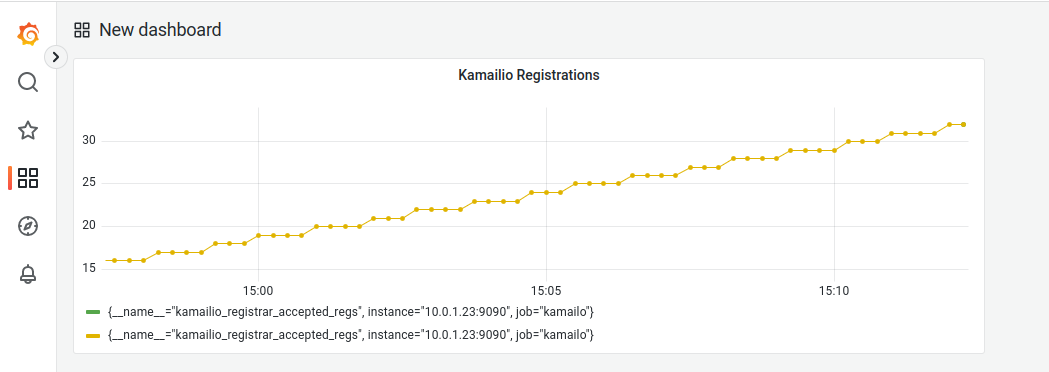
After a few clicks in Grafana we can run some graphs for this data too:

So that’s it, Kamailio’s core stats are now exposed to Prometheus, and we can render this information in Grafana.
There’s a copy of the full code used here available in the Github, and in our next post we’ll look at defining our own metrics in Kamailio and then interacting with them.
Can you share Kamailio Grafana json
Regarding outages, what important metrics do you suggest to cover using this?
Oh super good question, but super complex answer.
Very generic – Shared memory and failure rates (2xx rates vs 4xx / 5xx / 6xx rate), but in reality also TPS, sometimes registrations, retransmissions, etc, etc.