Category Archives: Linux

Adventures with Tape

For a long time I’ve run my own backups to a portable hard drive using Duplicity / Dejavu.

It’s worked really well, it’s dammed slow to pull back a file I’ve accidentally deleted, or need an old version of (which I probably go back to every 6 months or so), but it’s fast to backup, and I do that a whole lot more than I recover. I’ve even used it when swapping laptops to move all my data as a test, plus the slowness of recovery acts as a good deterrent to me doing dumb things like dropping partition tables and needing to use the backup.

That worked fine as an individual but at work the team is generating more and more data, and I needed a way to backup all our shared drives and docs, which is constantly growing, which means I needed a solution that didn’t involve just buying a lot of drives at crack money.

So I got a tape deck.

It seemed like a good solution; I like that I can eject the tape, and that I can just append to tape with (minimal) risk of nuking the data already there. These two points were how I justified it logically, but it’s also weird tech I haven’t used before (which was the main driver for me wanting to use it).

My first few problems with tape are:

  1. I have more data than a single tape can handle
  2. I have more data than I have free storage capacity to buffer it
  3. I have no idea how to use a tape drive or how to connect it

The Bits

LTO-6 seems like a sweet spot for tape storage at 2.5TB uncompressed (Sure you can buy LTO-10 drives, with 40TB capacity, but they cost more than my car), however because this is an experiment I picked up an LTO-4 (800GB uncompressed) tape drive for $50, plus 10 tapes ($60 / $6 each) so I could try it all out.

The tape drive as it arrived

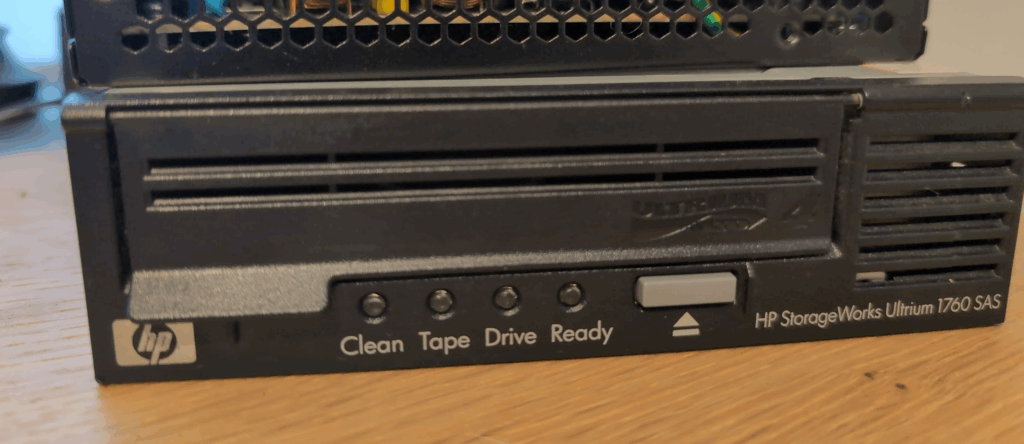
The tape drive has SAS connectors on it, my homelab server has SAS drives in it (A Dell R630 that lives under the couch in my office my dog sleep on when I’m at work), but there’s no way I’m fitting this chonky tape drive into a 2.5″ disk bay.

Searching online told me to buy a “Dell 0T93GD T93GD LSI 9300-8e 12Gbps Dual-Port External SAS HBA Controller” which I duly spent $55 on without really understanding what exactly an HBA is.

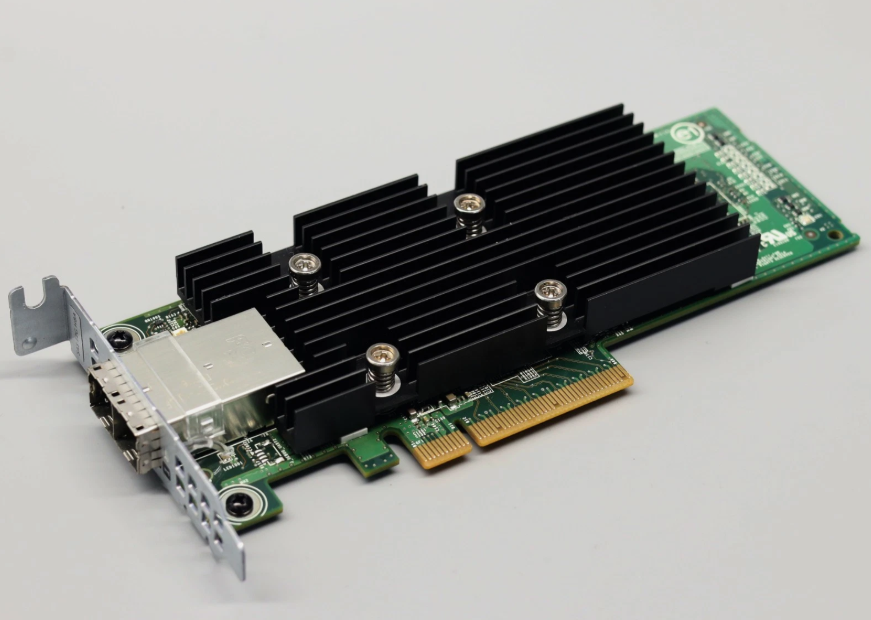
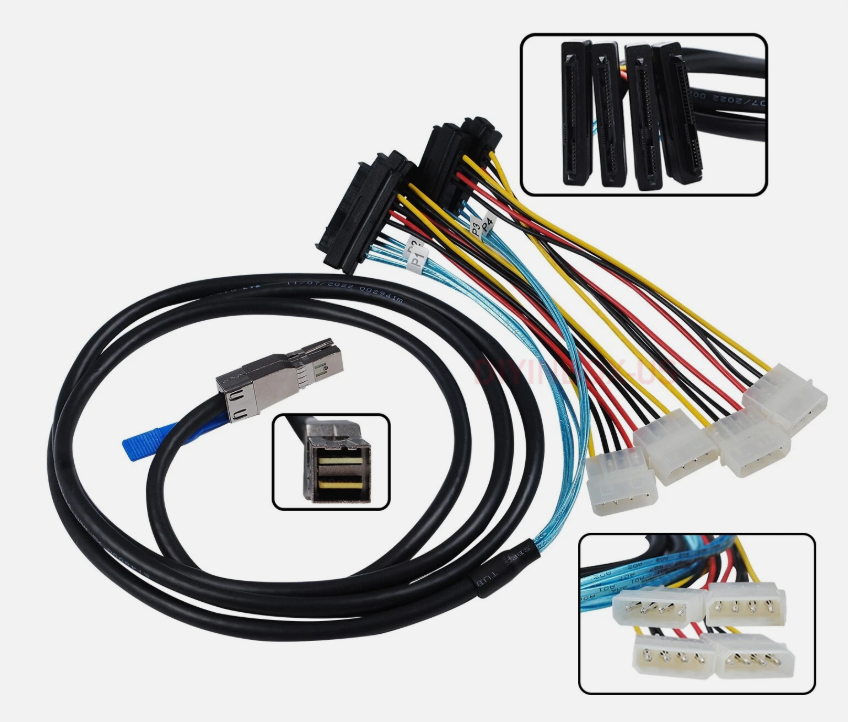
Being an HBA it’s got the Mini-SAS HD (SFF-8644) connector, which does not look like the SAS connector on my tape drive, so I needed a Mini-SAS HD (SFF-8644) to 29Pin SAS cable, and I grabbed a long one as the tape drive lives on the desk not under the couch.

Wiring it Up

I used my advanced plugging skills to plug things in. I’m not really sure why I added a heading here, I just plugged the female SAS cable into the tape drive, hooked an ATX power supply with a paperclip shoved in it into the ATX supply to turn it on, and plugged the other end into the server.

Expert cable management

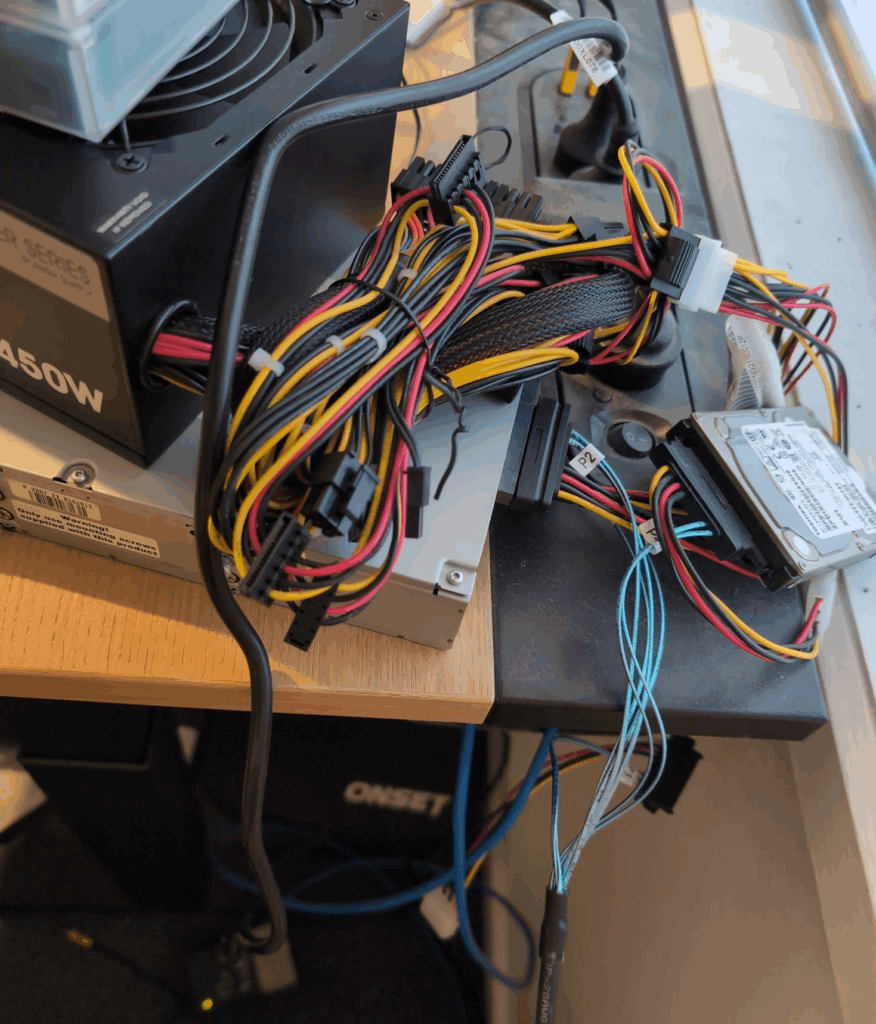
In the end I grabbed a spare 10K SAS magnetic drive with 1.8T on it, and used that as a cache on the same HBA, so I’d pull the files onto there, an then push them sequentially to the tape.

Then inside Proxmox I passed the PCI device for the HBA adapter into the VM.

Proxmox passthrough

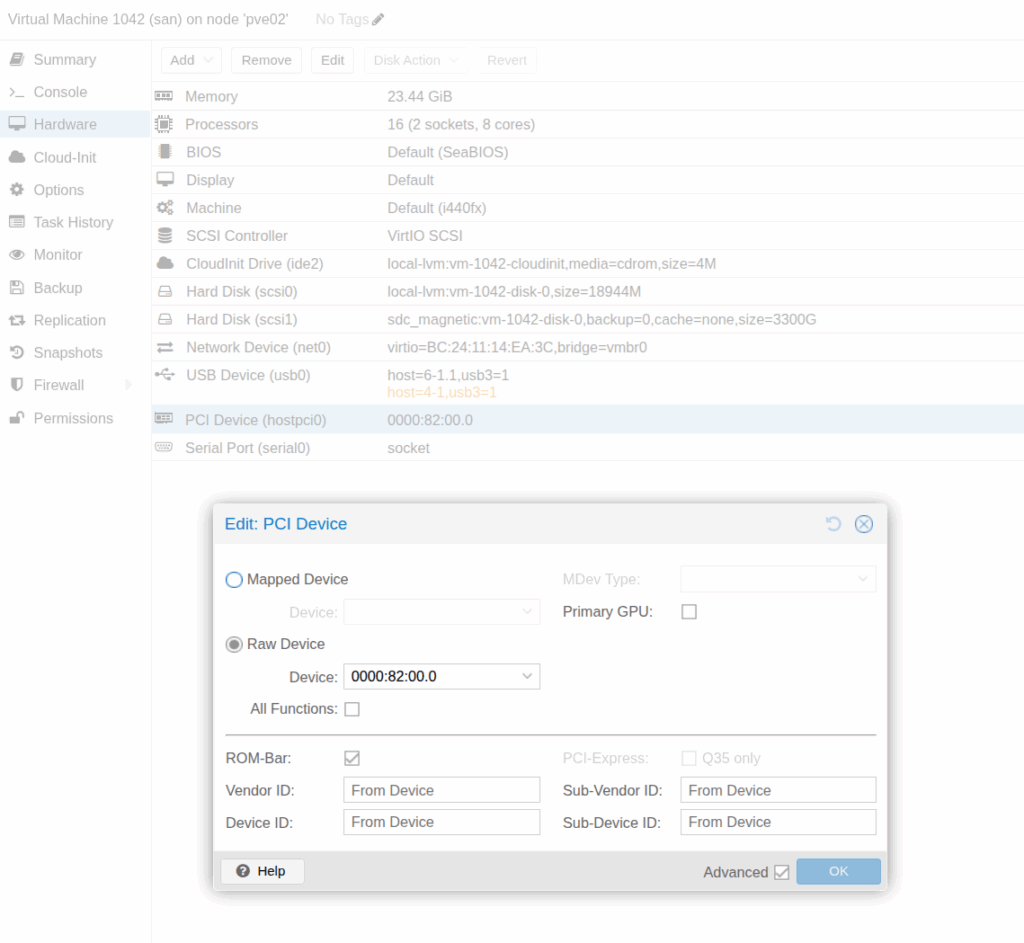
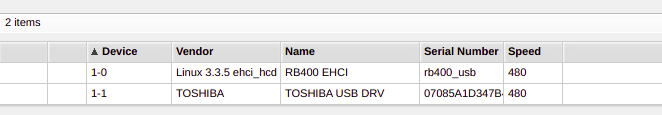
Linux just detected it as a tape drive, and we’re good to go.

The next issue I ran into was read and write speeds of the magnetic cache drive, and the tape.

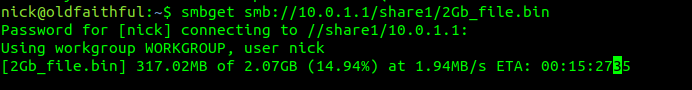
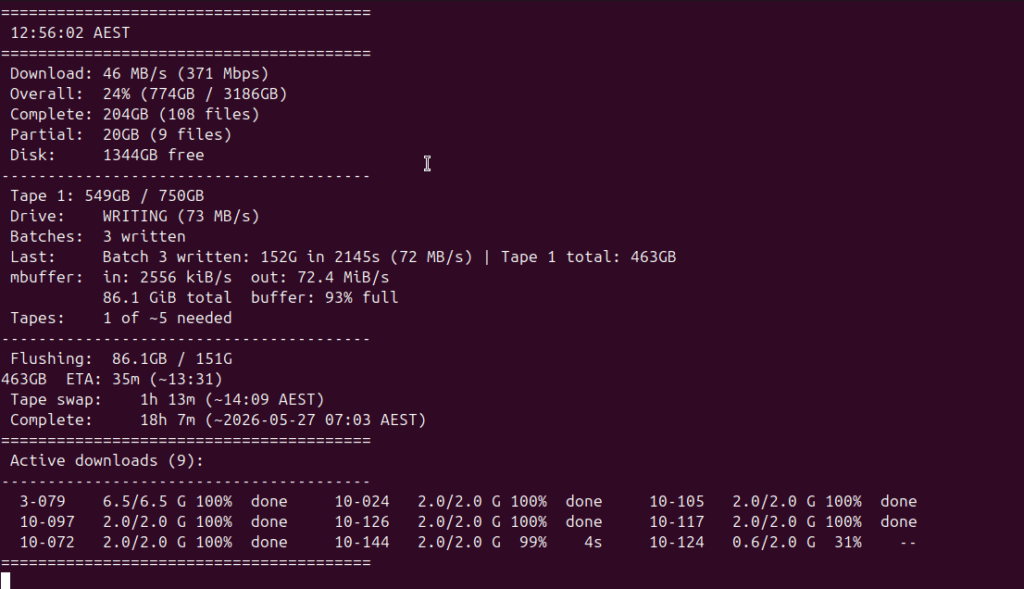
The fastest I could pull from Google and write to disk was ~480Mbps (Okay because we’re dealing with storage for the most part, I’ll deal in MB/s which is ~58MB/s), I’ve got more capacity on the link to Google, but not on the drive which tops out around here.

The tape writes at a pretty sustained 72MB/s, so tape writes faster than the disk it’s reading from, which meant the tape jobs finished ~20% faster than the cache filled, this is good because it allowed me to sleep without needing to swap tapes in the middle of the night or fill the cache disk.

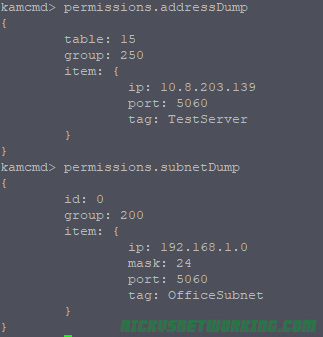
I tried Baccula but it’s not great for this “I have a bunch of data to dump onto a drive” problem, so I instead used tar which stands for “Tape Archive” (who knew) to compress the files and put them all onto tapes.

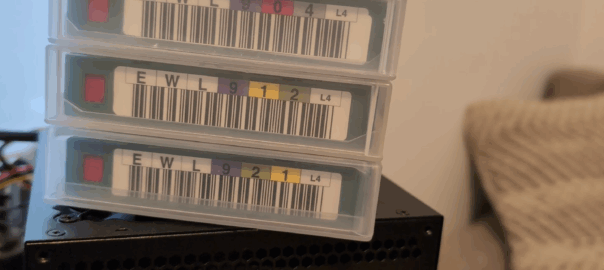
The write took a good long while – ~20 hours, but I validated each one as I went and created a file manifest so if I need a particular archive I know which tape it’s on (labeled with advanced Sharpie).

So the result of the experiment?

Well, the data is backed up, and I now have a good long term storage solution, I also backed up all the family photo albums,

Will I buy an LTO-6 or LTO-7 drive and use this more frequently? Maybe. But did I enjoy learning about it and messing around with a weird storage format, you betcha.

private_data_dir on Ansible Runners called from Python

We’ve got a web based front end in our CRM which triggers Ansible Playbooks for provisioning of customer services, this works really well, except I’d been facing a totally baffling issue of late.

Ansible Plays (Provisioning jobs) would have variables set that they inherited from other Ansible Plays, essentially if I set a variable in Play X and then ran Play Y, the variable would still be set.

I thought this was an issue with our database caching the play data showing the results from a previous play, that wasn’t the case.

Then I thought our API that triggers this might be passing extra variables in that it had cached, wasn’t the case.

In the end I ran the Ansible function call in it’s simplest possible form, with no API, no database, nothing but plain vanilla Ansible called from Python

    # Run the actual playbook
    r = ansible_runner.run(
        private_data_dir='/tmp/',
        playbook=playbook_path,
        extravars=extra_vars,
        inventory=inventory_path,
        event_handler=event_handler_obj.event_handler,
        quiet=False
    )

And I still I had the same issue of variables being inherited.

So what was the issue? Well the title gives it away, the private_data_dir parameter creates a folder in that directory, called env/extravars which a JSON file lives with all the vars from all the provisioning runs.

Removing the parameter from the Python function call resolved my issue, but did not give me back the half a day I spent debugging this…

DNS – TCP or UDP?

Ask someone with headphones and a lanyard in the halls of a datacenter what transport does DNS use, there’s a good chance the answer you’d get back is UDP Port 53.

But not always!

In scenarios where the DNS response is large (beyond 512 bytes) a DNS query will shift over to TCP for delivery.

How does the client know when to shift the request to TCP – After all, the DNS server knows how big the response is, but the client doesn’t.

The answer is the Truncated flag, in the response.

The DNS server sends back a response, but with the Truncated bit set, as per RFC 1035:

TC TrunCation – specifies that this message was truncated due to length greater than that permitted on the transmission channel.

RFC 1035

Here’s an example of the truncated bit being set in the DNS response.

The DNS client, upon receiving a response with the truncated bit set, should run the query again, this time using TCP for the transport.

One prime example of this is DNS NAPTR records used for DNS in roaming scenarios, where the response can quite often be quite large.

If it didn’t move these responses to TCP, you’d run the risk of MTU mismatches dropping DNS. In that half of my life has been spent debugging DNS issues, and the other half of my life debugging MTU issues, if I had MTU and DNS issues together, I’d be looking for a career change…

FreeSWITCH mod_python3 – Python Dialplans

Sometimes FreeSWITCH XML dialplan is a bit cumbersome to do more complex stuff, particularly to do with interacting with APIs, etc. But we have the option of using scripts written in Python3 to achieve our outcomes and pass variables to/from the dialplan and perform actions as if we were in the dialplan.

This is different to the Event Socket interface for Python I’ve covered in the past.

For starters we’ll need to install the module and enable it, here’s the StackOverflow thread that got me looking at it where I share the setup steps.

Here is a very simple example I’ve put together to show how we interact with Python3 in FreeSWITCH:

We’ll create a script in /usr/share/freeswitch/scripts/ and call it “CallerName.py”

from freeswitch import *
import sys 
def handler(session,args):

    #Get Variables from FreeSWITCH
    user_name = str(session.getVariable("user_name"))
    session.execute("log", "Call from Username: " + str(user_name))

    #Check if Username is equal to Nick
    if user_name == "Nick":
        session.execute("log", "Username is Nick!")
        #Convert the Username to Uppercase
        session.execute("set", "user_name=" + str(user_name).upper())
        #And return to the dialplan
        return
    else:
        #If no matches then log the error
        session.execute("log", "CRIT Username is not Nick - Hanging up the call")
        #And reject the call
        session.execute("hangup", "CALL_REJECTED")

Once we’ve created and saved the file, we’ll need to ensure it is owned by and executable by service user:

chown freeswitch:freeswitch CallerName.py
chmod 777 CallerName.py

In our Dialplan we’ll need to add the below to our logic to get called at the time we want it:

<action application="system" data="export PYTHONPATH=$PYTHONPATH:/usr/share/freeswitch/scripts/"/> <action application="python" data="CallerName"/>

After adding this to the dialplan, we’ll need to run a “reloadxml” to reload the dialplan, and now when these actions are hit, the Python script we created will be called, and if the user_name variable is set to “nick” it will be changed to “NICK”, and if it it isn’t, the call will be hung up with a “CALL_REJECTED” response.

Obviously this is a very basic scenario, but I’m using it for things like ACLs from an API, and dynamic call routing, using the familiar and easy to work with Python interpreter.

Scratch’n’Sniff – An easy tool for remote Packet Captures

A lesson learned a long time ago in Net Eng, is that packet captures (seldom) lie, and the answers are almost always in the packets.

The issue is just getting those packets.

The Problem

But if you’re anything like me, you’re working on remote systems from your workstation, and trying to see what’s going on.

For me this goes like this:

  1. SSH into machine in question
  2. Start TCPdump
  3. Hope that I have run it for long enough to capture the event of interest
  4. Stop TCPdump
  5. Change permissions on PCAP file created so I can copy it
  6. SFTP into the machine in question
  7. Transfer the PCAP to my local machine
  8. View the PCAP in Wireshark
  9. Discover I had not run the PCAP for long enough and repeat

Being a Mikrotik user I fell in love with the remote packet sniffer functionality built into them, where the switch/router will copy packets matching a filter and just stream them to the IP of my workstation.

If only there was something I could use to get this same functionality on remote machines – without named pipes, X11 forwarding or any of the other “hacky” solutions…

The Solution

Introducing Scratch’n’Sniff, a simple tcpdump front end that encapsulates all the filtered traffic of interest in TZSP the same as Mikrotiks do, and stream it (in real time) to your local machine for real time viewing in Wireshark.

Using it is very simple:

Capture all traffic on port 5060 on interface enp0s25 and send it to 10.0.1.252
python3 scratchnsniff.py --dstip 10.0.1.252 --packetfilter 'port 5060' --interface enp0s25

Capture all sctp and icmp traffic on interface lo and send it to 10.98.1.2:
python3 scratchnsniff.py --dstip 10.98.1.2 --packetfilter 'sctp or icmp' --interface lo

If you’re keen to try it out you can grab it from GitHub – Scratch’n’Sniff and start streaming packets remotely.

Enjoy!

Fixing Wireshark / TCPdump pcap: network type 276 unknown or unsupported Error

Ubuntu 20.04 repos have a fairly outdated release of Wireshark, and the other day when trying to open a packet capture I got the below error:

After doing an apt-get update && apt-get upgrade wireshark, the version of Wireshark, and the issue remained.

I have compiled Wireshark from source before, but it’s a real headache, so instead I just added the Wireshark PPA with:

sudo add-apt-repository ppa:wireshark-dev/stable
sudo apt-get update -y
sudo apt-get upgrade wireshark

And presto, latest (stable) build of Wireshark, and error gone when opening PCAPs!

Wireguard in Mikrotik RouterOS

Recently I’ve been using Wireguard to fix the things I once used IPsec for.

It was merged into the Mainline Linux kernel late last year, and then in RouterOS 7.0beta7 (2020-Jun-3) the system kernel on RouterOS was upgraded to version 5.6.3 which contains Wireguard support.

Unfortunately this feature is going to stay in the Unstable / Development releases for the time being until a kernel update is done for the stable release to 5.5.3 or higher, but for now I thought I’d try it out.

After loading a beta version of the firmware, under Interfaces I have the option to add a Wireguard interface, for clients to connect to my Mikrotik using Wireguard.

It’s nice and simple to see the public/private key pair (a new key pair is generated for each Wireguard instance which is nifty) that we an use to authenticate / be authenticated.

If we want to configure remote peers, we do this by jumping over to the Wireguard -> Peers tab, allowing us to setup Peers from here.

Obviously routing and firewalls remain to be setup, but I love the simplicity of Wireguard, and in the RouterOS implimentation this is kept.

Open5GS without NAT

While most users of Open5GS EPC will use NAT on the UPF / P-GW-U but you don’t have to.

While you can do NAT on the machine that hosts the PGW-U / UPF, you may find you want to do the NAT somewhere else in the network, like on a router, or something specifically for CG-NAT, or you may want to provide public addresses to your UEs, either way the default config assumes you want NAT, and in this post, we’ll cover setting up Open5GS EPC / 5GC without NAT on the P-GW-U / UPF.

Before we get started on that, let’s keep in mind what’s going to happen if we don’t have NAT in place,

Traffic originating from users on our network (UEs / Subscribers) will have the from IP Address set to that of the UE IP Pool set on the SMF / P-GW-C, or statically in our HSS.

This will be the IP address that’s sent as the IP Source for all traffic from the UE if we don’t have NAT enabled in our Core, so all external networks will see that as the IP Address for our UEs / Subscribers.

The above example shows the flow of a packet from UE with IP Address 10.145.0.1 sending something to 1.1.1.1.

This is all well and good for traffic originating from our 4G/5G network, but what about traffic destined to our 4G/5G core?

Well, the traffic path is backwards. This means that our router, and external networks, need to know how to reach the subnet containing our UEs. This means we’ve got to add static routes to point to the IP Address of the UPF / P-GW-U, so it can encapsulate the traffic and get the GTP encapsulated traffic to the UE / Subscriber.

For our example packet destined for 1.1.1.1, as that is a globally routable IP (Not an internal IP) the router will need to perform NAT Translation, but for internal traffic within the network (On the router) the static route on the router should be able to route traffic to the UE Subnets to the UPF / P-GW-U’s IP Address, so it can encapsulate the traffic and get the GTP encapsulated traffic to the UE / Subscriber.

Setting up static routes on your router is going to be different on what you use, in my case I’m using a Mikrotik in my lab, so here’s a screenshot from that showing the static route point at my UPF/P-GW-U. I’ve got BGP setup to share routes around, so all the neighboring routers will also have this information about how to reach the subscriber.

Next up we’ve got to setup IPtables on the server itself running our UPF/P-GW-U, to route traffic addressed to the UE and encapsulate it.

sudo ip route add 10.145.0.0/24 dev ogstun
sudo echo 1 > /proc/sys/net/ipv4/ip_forward
sudo iptables -A FORWARD -i ogstun -o osgtun -s 10.145.0.0/24 -d 0.0.0.0/0 -j ACCEPT

And that’s it, now traffic coming from UEs on our UPF/P-GW will leave the NIC with their source address set to the UE Address, and so long as your router is happily configured with those static routes, you’ll be set.

If you want access to the Internet, it then just becomes a matter of configuring traffic from that subnet on the router to be NATed out your external interface on the router, rather than performing the NAT on the machine.

In an upcoming post we’ll look at doing this with OSPF and BGP, so you don’t need to statically assign routes in your routers.

Remember Bash History Forever

History in Bash is a huge time saver.

That beautifully crafted sed command you put together to replace the contents of something a few months ago? Just search through your Bash history and there it is.

Previously I’d been grepping the output of history to find what I was looking for, and now I’ve fallen in love with the search feature, but by default, many Linux distros limit the number of lines in the Bash history to 2,000. If you’re a regular Linux user, this isn’t cutting the mustard.

By default the bashrc file that ships with Ubuntu is limited to 2,000 lines or 1MB,

We can change all this very easily, by editing the ~/.bashrc file (Bash shell script), upping the limit of entries we keep. While you’re at it adding HISTTIMEFORMAT allows you to timestamp the commands you’re running, and the PROMPT_COMMAND below also writes immediately, so you won’t get lost data or missing stuff that you’ve just run in another terminal.

Example contents of ~/.bashrc:

export HISTSIZE=100000
export HISTFILESIZE=200000
export HISTTIMEFORMAT='%d/%m/%y %T '
PROMPT_COMMAND="history -a; $PROMPT_COMMAND"

And you can apply the changes with:

source ~/.bashrc

Being mean to Mikrotiks – Pushing SMB File Share

I’d tried in the past to use the USB port on the Mikrotik, an external HDD and the SMB server in RouterOS, to act as a simple NAS for sharing files on the home network. And the performance was terrible.

This is because the device is a Router. Not a NAS (duh). And everything I later read online confirmed that yes, this is a router, not a NAS so stop trying.

But I recently got a new Mikrotik CRS109, so now I have a new Mikrotik, how bad is the SMB file share performance?

To test this I’ve got a USB drive with some files on it, an old Mikrotik RB915G and the new Mikrotik CRS109-8G-1S-2HnD-IN, and compared the time it takes to download a file between the two.

Mikrotik Routerboard RB951G

While pulling a 2Gb file of random data from a FAT formatted flash drive, I achieved a consistent 1.9MB/s (15.2 Mb/s)

nick@oldfaithful:~$ smbget smb://10.0.1.1/share1/2Gb_file.bin
 Password for [nick] connecting to //share1/10.0.1.1: 
 Using workgroup WORKGROUP, user nick
 smb://10.0.1.1/share1/2Gb_file.bin                                                                                                                                              
 Downloaded 2.07GB in 1123 seconds

Mikrotik CRS109

In terms of transfer speed, a consistent 2.8MB/s (22.4 Mb/s)

nick@oldfaithful:~$ smbget smb://10.0.1.1/share1/2Gb_file.bin
 Password for [nick] connecting to //share1/10.0.1.1: 
 Using workgroup WORKGROUP, user nick
 smb://10.0.1.1/share1/2Gb_file.bin                                              
 Downloaded 2.07GB in 736 seconds

Profiler shows 25% CPU usage on “other”, which drops down as soon as the file transfers stop,

So better, but still not a NAS (duh).

The Verdict

Still not a NAS. So stop trying to use it as a NAS.

As my download speed is faster than 22Mbps I’d just be better to use cloud storage.

Control + R in Bash = Life Changed

I’m probably late to the party on this one.

I was working with someone the other day on a problem over a video call and sharing my screen on a Linux box.

They watched as I did what I do often and Grep’ed through my command history to find a command I’d run before but couldn’t remember the specifics of off the top of my head.

Something like this:

How I’ve always found commands from my history

Then the person I was working with told me to try pressing Control + R and typing the start of what I was looking for.

My head exploded.

Searching through Bash command history

From here you can search through your command history and scroll between matching entries,

I cannot believe it’s taken me this long to learn!

Want more? 
You can also get the weekly posts on the blog by Connecting on LinkedIn, following me on Twitter, or Subscribing via RSS.

Docker Cheatsheet

I kept forgetting the basic Docker commands, so I made a cheat sheet for myeslf and thought I’d share:

List running Containers:
docker ps
List all Containers (Including stopped)
docker ps -a
Start a Container
docker run sdfjkdskj/sdfdsafa
List Images
docker image list
Build an Image
docker build -t myapp:v1 .
Connect to Shell of running Container
docker exec -it intelligent_chebyshev /bin/bash

mkcert – Simple Localhost Certs

Oftentimes I’m developing something locally and I need an SSL Certificate.

I’m too cheap to buy a valid SSL cert for a subdomain like “dev.nickvsnetworking.com” and often the domain changes based on what I’m doing,

LetsEncrypt is great, but requires your server to be public facing and be a web server, which for dev stuff isn’t really practical,

Enter mkcert – a tool that allows you to generate valid SSL certificates on your machine for any domain, the catch is that it’s only on your machine.

I’m working on a WebSocket platform at the moment, which requires an SSL certificate.

So I set an entry in my hosts file to point “webrtc” to the IP of one of the machines,

I then generated the cert on my local machine,

mkcert -install webrtc 

Which outputs the certificate and private key, which I copied it onto the server I’m working on, twiddled some knobs in Apache2 and presto, valid cert!

The downside is of course anyone else going to this site would see the cert as invalid, but as it’s just me, it doesn’t matter!

You can get Mkcert from GitHub.

Kamailio Bytes – Siremis Installation

Siremis is a web interface for Kamailio, created by the team at Asipto, who contribute huge amounts to the Kamailio project.

Siremis won’t create your Kamailio configuration file for you, but allows you to easily drive the dynamic functions like dialplan, subscribers, dispatcher, permissions, etc, from a web interface.

Siremis essentially interfaces with the Kamailio database, kamcmd and kamctl to look after your running Kamailio instance.

Installation

I’ll be installing on Ubuntu 18.04, but for most major distributions the process will be the same. We’re using PHP7 and Apache2, which are pretty much universal available on other distros.

First we need to install all the packages we require:

apt-get update

apt-get upgrade

apt-get install kamailio* mysql-server apache2 php php-mysql php-gd php-curl php-xml libapache2-mod-php php-pear php-xmlrpc make

Enable apache2 rewrite & restart Apache

a2enmod rewrite
service apache2 reload

Next we’ll download Siremis from the Git repo, and put it into a folder, which I’ve named the same as my Kamailio version.

cd /var/www/html/
git clone https://github.com/asipto/siremis kamailio-5.1.2

Now we’ll move into the directory we’ve created (called kamailio-5.1.2) and build the apache2 config needed:

cd kamailio-5.1.2/
make apache24-conf

This then gives us a config except we can put into our Apache virtual host config file:

We can now copy and paste this into the end of an existing or new Apache virtual host file.

If this is a fresh install you can just pipe the output of this into the config file directly:

make apache24-conf >> /etc/apache2/sites-available/000-default.conf
service apache2 restart

Now if you browse to http://yourserverip/siremis you should be redirected to http://yourserverip/siremis/install and have a few errors, that’s OK, it means our Apache config is working.

Next we’ll set the permissions, create the folders and .htaccess. The Siremis team have also created make files to take care of this too, so we can just run them to set everything up:

make prepare24
make chown

With that done we can try browsing to our server again ( http://yourserverip/siremis ) and you should hit the installation wizard:

Now we’ll need to setup our database, so we can read and write from it.

We’ll create new MySQL users for Kamailio and Seremis:


mysql> GRANT ALL PRIVILEGES ON siremis.* TO siremis@localhost IDENTIFIED BY 'siremisrw';

mysql> CREATE USER 'kamailio'@'localhost' IDENTIFIED BY 'my5yhtY7zPJzV8vu';

mysql> GRANT ALL PRIVILEGES ON * . * TO 'kamailio'@'localhost';

mysql> FLUSH PRIVILEGES;

Next up we’ll need to configure kamctlrc so it knows the database details, we covered this the Security in Practice tutorial.

We’ll edit /etc/kamalio/kamctlrc and add our database information:

Once that’s done we can create the database and tables using kamdbctl the database tool:

kamdbctl create

I’ve selected to install the optional tables for completeness.

Once this is done we can go back to the web page and complete the installation wizard:

We’ll need to fill the password for the Siremis DB we created and for the Kamailio DB, and ensure all the boxes are ticked.

Next, Next, Next your way through until you hit the login page, login with admin/admin and you’re away!

Troubleshooting

If you have issues during the installation you can re-run the installation web wizard by removing the install.lock file in /var/www/html/kamailio-5.1.2/siremis

You can also try dropping the Siremis database and getting the installer to create it again for you:

mysql> drop database siremis;

Setup HOMER SIP captagent and HEP processor on Ubuntu 18.04

There are a number of ways to feed Homer data, in this case we’re going to use Kamailio, which has a HEP module, so when we feed Kamailio SIP data it’ll use the HEP module to encapsulate it and send it to the database for parsing on the WebUI.

We won’t actually do any SIP routing with Kamailio, we’ll just use it to parse copies of SIP messages sent to it, encapsulate them into HEP and send them to the DB.

We’ll be doing this on the same box that we’re running the HomerUI on, if we weren’t we’d need to adjust the database parameters in Kamailio so it pushes the data to the correct MySQL database.

apt-get install kamailio* kamailio-mysql-modules captagent

Next we’ll need to configure Kamailio to capture data from captagent, for this we’ll use the provided config.

cp homer-api/examples/sipcapture/sipcapture.kamailio /etc/kamailio/kamailio.cfg

/etc/init.d/kamailio restart

Next we’ll need to configure captagent to capture data and feed it to Kamailio. There’s two things we’ll need to change from the default, the first is the interface we capture on (By default it’s eth0, but Ubuntu uses eth33 as the first network interface ID) and the second is the HEP destination we send our data to (By default it’s on 9061 but our Kamailio instance is listening on 9060).

We’ll start by editing captagent’s socket_pcap.xml file to change the interface we capture on:

vi /etc/captagent/socket_pcap.xml 
HOMER Captagent Interface Setup

Next we’ll edit the port that we send HEP data on

vi /etc/captagent/transport_hep.xml
Set HEP Port for Transport

And finally we’ll restart captagent

/etc/init.d/captagent

Now if we send SIP traffic to this box it’ll be fed into HOMER.

In most use cases you’d use a port mirror so you may need to define the network interface that’s the destination of the port mirror in socket_pcap.xml

Kamailio Bytes – SCTP

I’ve talked about how cool SCTP is in the past, so I thought I’d describe how easy it is to start using SCTP as the Transport protocol in Kamailio.

I’m working on a Debian based system, and I’ll need to install libsctp-dev to use the SCTP module.

apt-get install libsctp-dev

Next we’ll edit the Kamailio config to load module sctp in the loadmodules section:

...
loadmodule "sctp.so"
...

Now we’ll start listening on SCTP, so where your current listen= entries are we’ll add one:

listen=sctp:0.0.0.0:5060

I’ve loaded Dispatcher for this example, and we’ll add a new entry to Dispatcher so we can ping ourselves.

We’ll use kamctl to add a new dispatcher entry of our loopback IP (127.0.0.1) but using SCTP as the transport.

kamctl dispatcher add 1 'sip:127.0.0.1:5060;transport=sctp' 0 0 '' 'Myself SCTP'

Now I’ll restart Kamailio and check kamcmd:

kamcmd dispatcher.list

All going well you’ll see the entry as up in Dispatcher:

And firing up tcpdump should show you that sweet SCTP traffic:

tcpdump -i lo -n sctp

Sadly by default TCPdump doesn’t show our SIP packets as they’re in SCTP, you can still view this in Wireshark though:

Here’s a copy of the packet capture I took:

I’ve put a copy of my basic config on GitHub.

Now get out there and put SCTP into the real world!

Kamailio Bytes – Setting up rtpengine in Kamailio to relay RTP / Media

In an ideal world all media would go direct from one endpoint to another.

But it’s not an ideal world and relaying RTP / media streams is as much a necessary evil as transcoding and NAT in the real world.

The Setup

We’ll assume you’ve already got a rtpengine instance on your local machine running, if you don’t check out my previous post on installation & setup.

We’ll need to load the rtpengine module and set it’s parameters, luckily that’s two lines in our Kamailio file:

loadmodule "rtpengine.so"
...
modparam("rtpengine", "rtpengine_sock", "udp:localhost:2223")

Now we’ll restart Kamailio and use kamcmd to check the status of our rtpengine instance:

kamcmd rtpengine.show all

All going well you’ll see something like this showing your instance:

Putting it into Practice

If you’ve ever had experience with the other RTP proxies out there you’ll know you’ve had to offer, rewrite SDP and accept the streams in Kamailio.

Luckily rtpengine makes this a bit easier, we need to call rtpengine_manage(); when the initial INVITE is sent and when a response is received with SDP (Like a 200 OK).

So for calling on the INVITE I’ve done it in the route[relay] route which I’m using:

And for the reply I’ve simply put a conditional in the onreply_route[MANAGE_REPLY] for if it has SDP:

route[RELAY]{
   ...
   rtpengine_manage();
   ...
}
onreply_route[MANAGE_REPLY] {
        xdbg("incoming reply\n");
        if(status=~"[12][0-9][0-9]") {
                route(NATMANAGE);
        }
        rtpengine_manage();


}

And that’s it, now our calls will get RTP relayed through our Kamailio box.

Advanced Usage

There’s a bunch of more cool features you can use rtpengine for than just relay, for example:

  • IPv4 <-> IPv6 translation for Media
  • ICE Bridging
  • SRTP / Encrypted RTP to clear RTP bridging
  • Transcoding
  • Repacketization
  • Media Playback
  • Call Recording

I’ll cover some of these in future posts.

Here’s a copy of my running config on GitHub.

For more in-depth info on the workings of RTP check out my post RTP – More than you wanted to Know

Magma – Facebook’s Open Source LTE / 4G EPC/OSS Platform

In February Facebook announced they’d open sourced their Magma project,

Magma provides a software-centric distributed mobile packet core and tools for automating network management.

Open-sourcing Magma to extend mobile networks

Magma’s modular software based architecture means you can scale up extra resources as needed, with no need to have physical hardware to run your EPC.

(Cisco’s Ultra Packet Core does have a virtualisation option, but it’s not cheap)

I got pretty excited by this, so I’ve ordered myself an eNodeB (Just a Picocell), a pile of USIMs, programmer and started installing an environment.

In the past I’ve used srsEPC and NextEPC and software-defined radio hardware (BladeRF) to run LTE stuff, so I’m looking forward to seeing if I can implement parts of them into Magma, and also eventually use Kamailio’s IMS modules to implement an IMS core and run VoLTE.

So let’s install Magma, explore it and lurk on the Discord, all while we kill time waiting for hardware to arrive!

SNgrep – Command line SIP Debugging

If you, like me, spend a lot of time looking at SIP logs, sngrep is an awesome tool for debugging on remote machines. It’s kind of like if VoIP Monitor was ported back to the days of mainframes & minimal remote terminal GUIs.

Installation

It’s in the Repos for Debian and Ubuntu:

apt-get install sngrep

GUI Usage

sngrep can be used to parse packet captures and create packet captures by capturing off an interface, and view them at the same time.

We’ll start by just calling sngrep on a box with some SIP traffic, and waiting to see the dialogs appear.

Here we can see some dialogs, two REGISTERs and 4 INVITEs.

By using the up and down arrow keys we can select a dialog, hitting Enter (Return) will allow us to view that dialog in more detail:

Again we can use the up and down arrow keys to view each of the responses / messages in the dialog.

Hitting Enter again will show you that message in full screen, and hitting Escape will bring you back to the first screen.

From the home screen you can filter with F7, to find the dialog you’re interested in.

Command Line Parameters

One of the best features about sngrep is that you can capture and view at the same time.

As a long time user of TCPdump, I’d been faced with two options, capture the packets, download them, view them and look for what I’m after, or view it live with a pile of chained grep statements and hope to see what I want.

By adding -O filename.pcap to sngrep you can capture to a packet capture and view at the same time.

You can use expression matching to match only specific dialogs.

Kamailio Bytes – Permissions Module

Kamailio’s permissions module is simple to use, and we’ve already touched upon it in the security section in our Kamailio 101 series, but I thought I’d go over some of it’s features in more detail.

At it’s core, Kamailio’s Permissions module is a series of Access Control Lists (ACLs) that can be applied to different sections of your config.

We can manage permissions to do with call routing, for example, is that source allowed to route to that destination.

We can manage registration permissions, for example, is this subnet allowed to register this username.

We can manage URI permissions & address permissions to check if a specific SIP URI or source address is allowed to do something.

We’ll touch on a simple IP Address based ACL setup in this post, but you can find more information in the module documentation itself.

The Setup

We’ll be using a database backend for this (MySQL), setup the usual way.

We’ll need to load the permissions module and setup it’s basic parameters, for more info on setting up the database side of things have a look here.

loadmodule "permissions.so"
...
modparam("permissions", "db_url", DBURL)
modparam("permissions", "db_mode", 1)

Next we’ll need to add some IPs, we could use Serimis for this, or a straight MySQL INSERT, but we’ll use kamctl to add them. (kamcmd can reload addresses but doesn’t currently have the functionality to add them)

kamctl address add 250 10.8.203.139 32 5060 TestServer
kamctl address add 200 192.168.1.0 24 5060 OfficeSubnet

The above example we added a two new address entries,

The first one added a new entry in group 250 of “10.8.203.139”, with a /32 subnet mask (Single IP), on port 5060 with the label “TestServer”,

The second one we added to group 200 was a subnet of 192.168.1.0 with a /24 subnet mask (255 IPs), on port 5060 with the label “OfficeSubnet”

On startup, or when we manually reload the addressTable, Kamailio grabs all the records and stores them in RAM. This makes lookup super fast, but the tradeoff is you have to load the entries, so changes aren’t immediate.

Let’s use Kamcmd to reload the entries and check their status.

kamcmd permissions.addressReload

kamcmd permissions.addressDump

kamcmd permissions.subnetDump

You should see the single IP in the output of the permissions.addressDump and see the subnet on the subnetDump:

Usage

It’s usage is pretty simple, combined with a simple nested if statement.

if (allow_source_address("200")) {
	xlog("Coming from address group 200");
};
if (allow_source_address("250")) {
	xlog("Coming from address group 250");
};

The above example just outputs to xlog with the address group, but we can expand upon this to give us our ACL service.

if (allow_source_address("200")) {
	xlog("Coming from address group 200");
}else if (allow_source_address("250")) {
	xlog("Coming from address group 250");
}else{
        sl_reply("401", "Address not authorised");
        exit;
}

If we put this at the top of our Kamailio config we’ll reply with a 401 response to any traffic not in address group 200 or 250.