I started off just updating the SPN, OPN, etc, etc, but I had a suspicion there were still references.
I confirmed this pretty easily with Wireshark, first I started a trace in Wireshark of the APDUs: I enabled capturing on a USB Interface:
modprobe usbmon
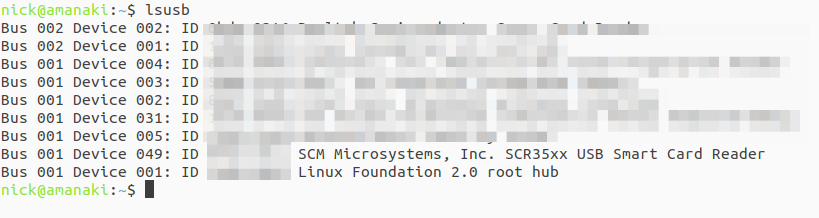
Then we need to find where our card reader is connected, running ‘lsusb‘ lists all the USB devices, and you can see here’s mine on Bus 1, Device 49.
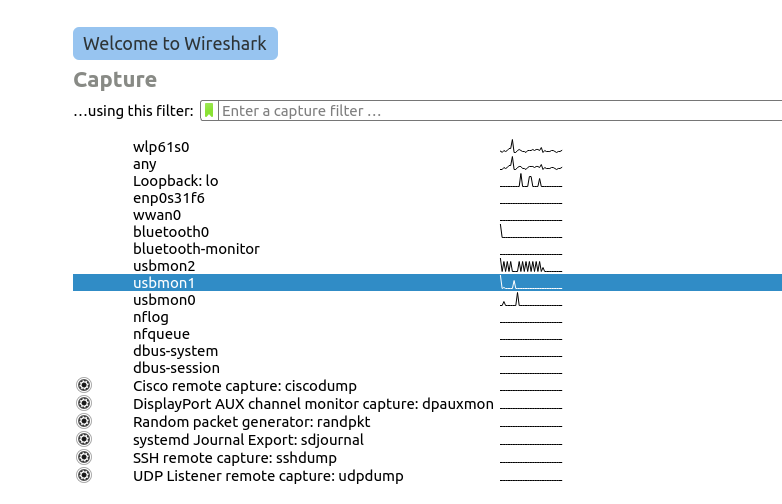
Then fired up Wireshark, selected USB Bus 01 to capture all the USB traffic on the bus.
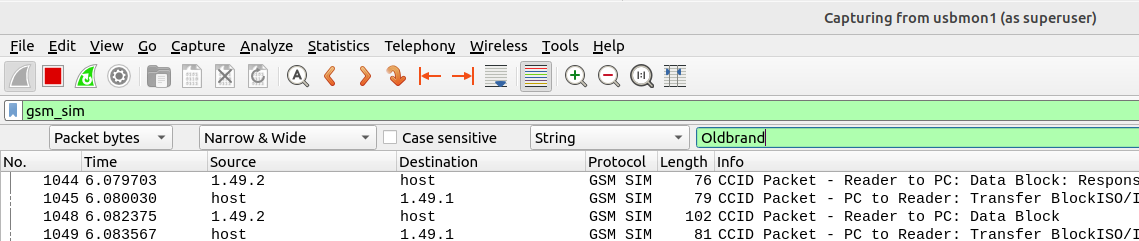
Then I ran the “export” command in PySIM to read the contents of all the files on the SIM, and jumped back over to Wireshark. (PySIM decodes most files but not all – Whereas this method just looks for the bytes containing the string)
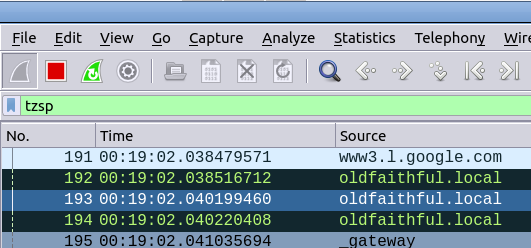
From the search menu in Wireshark I searched the packet bytes for the string containing the old brand name, and found two more EFs I’d missed.
For anyone playing along at home, using this method I found references to the old brand name in SMSP (which contains the network name) and ADN (Which had the customer support number as a contact with the old brand name).
If you work with IMS or Packet Core, there’s a good chance you need DNS to work, and it doesn’t always.
When I run traces, I’ve always found I get swamped with DNS traffic, UE traffic, OS monitoring, updates, etc, all combine into a big firehose – while my Wireshark filters for finding EPC and IMS traffic is pretty good, my achilles heel has always been filtering the DNS traffic to just get the queries and responses I want out of it.
Well, today I made that a bit better.
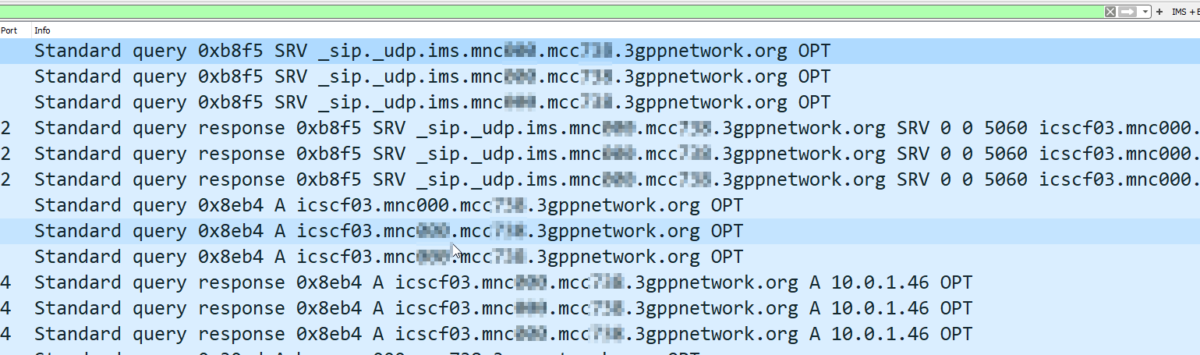
By adding this to your Wireshark filter:
dns contains 33:67:70:70:6e:65:74:77:6f:72:6b:03:6f:72:67:00
You’ll only see DNS Queries and Responses for domains at the 3gppnetwork.org domain.
This makes my traces much easier to read, and hopefully will do the same for you!
Bonus, here’s my current Wireshark filter for working EPC/IMS:
(diameter and diameter.cmd.code != 280) or (sip and !(sip.Method == "OPTIONS") and !(sip.CSeq.method == "OPTIONS")) or (smpp and (smpp.command_id != 0x00000015 and smpp.command_id != 0x80000015)) or (mgcp and !(mgcp.req.verb == "AUEP") and !(mgcp.rsp.rspcode == 500)) or isup or sccp or rtpevent or s1ap or gtpv2 or pfcp or (dns contains 33:67:70:70:6e:65:74:77:6f:72:6b:03:6f:72:67:00)
A lesson learned a long time ago in Net Eng, is that packet captures (seldom) lie, and the answers are almost always in the packets.
The issue is just getting those packets.
The Problem
But if you’re anything like me, you’re working on remote systems from your workstation, and trying to see what’s going on.
For me this goes like this:
SSH into machine in question
Start TCPdump
Hope that I have run it for long enough to capture the event of interest
Stop TCPdump
Change permissions on PCAP file created so I can copy it
SFTP into the machine in question
Transfer the PCAP to my local machine
View the PCAP in Wireshark
Discover I had not run the PCAP for long enough and repeat
Being a Mikrotik user I fell in love with the remote packet sniffer functionality built into them, where the switch/router will copy packets matching a filter and just stream them to the IP of my workstation.
If only there was something I could use to get this same functionality on remote machines – without named pipes, X11 forwarding or any of the other “hacky” solutions…
The Solution
Introducing Scratch’n’Sniff, a simple tcpdump front end that encapsulates all the filtered traffic of interest in TZSP the same as Mikrotiks do, and stream it (in real time) to your local machine for real time viewing in Wireshark.
Using it is very simple:
Capture all traffic on port 5060 on interface enp0s25 and send it to 10.0.1.252 python3 scratchnsniff.py --dstip 10.0.1.252 --packetfilter 'port 5060' --interface enp0s25
Capture all sctp and icmp traffic on interface lo and send it to 10.98.1.2: python3 scratchnsniff.py --dstip 10.98.1.2 --packetfilter 'sctp or icmp' --interface lo
If you’re keen to try it out you can grab it from GitHub – Scratch’n’Sniff and start streaming packets remotely.
I never cease to be amazed as to what I can do with Wireshark.
While we’re working with Smart Card readers and SIM cards, capturing and Decoding USB traffic to see what APDUs are actually being sent can be super useful, so in this post we’ll look at how we can use Wireshark to sniff the USB traffic to view APDUs being sent to smart cards from other software.
For the purposes of this post I’ll be reading the SIM cards with pySim, but in reality it’ll work with any proprietary SIM software, allowing you to see what’s actually being said to the card by your computer.
If you want to see what’s being sent between your phone and SIM card, the Osmocom SIMtrace is the device for you (And yes it also uses Wireshark for viewing this data!).
Ok, that’s all the prerequisites sorted, next we need to find the bus and device ID of our smart card reader,
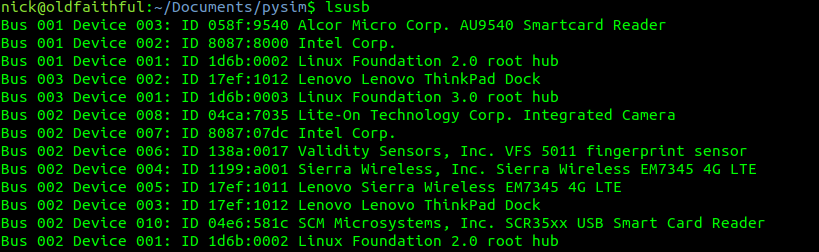
We can get this listed with
lsusb
Here you can see I have a Smart Card reader on Bus 1 device 03 and another on Bus 2 device 10.
The reader I want to use is the “SCM Microsystems, Inc. SCR35xx USB Smart Card Reader” so I’ll jott down Bus 2 device 10. Yours will obviously be different, but you get the idea.
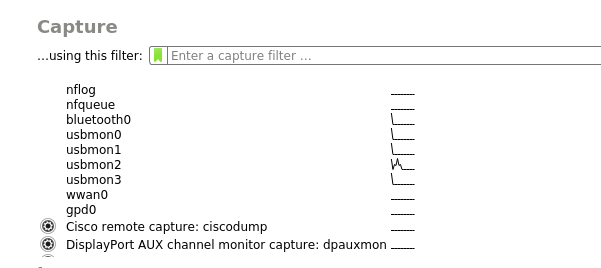
Finding the USB traffic in Wireshark
Next we’ll fire up Wireshark, if you’ve got your permissions right and followed along, you should see a few more interfaces starting with usbmonX in the capture list.
Because the device I want to capture from is on Bus 2, we’ll select usbmon2 and start capturing,
As you can see we’ve got a bit of a firehose of data, and we only care about device 10 on bus 2, so let’s filter for that.
So let’s generate some data and then filter for it, to generate some data I’m going to run pySim-read to read the data on a smart card that’s connected to my PC, and then filter to only see traffic on that USB device,
In my case as the USB device is 10 it’s got two sub addresses, so I’ll filter for USB Bus 2, device 10 sub-address 1 and 2, so the filter I’ll use is:
usb.addr=="2.10.1" or usb.addr=="2.10.2"
But this doesn’t really show us much, so let’s tell Wireshark this is PCSC/UCCID data to decode it as such;
So we’ll select some of this traffic -> Decode as -> USBCCID
Still not seeing straight APDUs, so let’s tell Wireshark one more bit of information – That we want to decode this information as GSM SIM data;
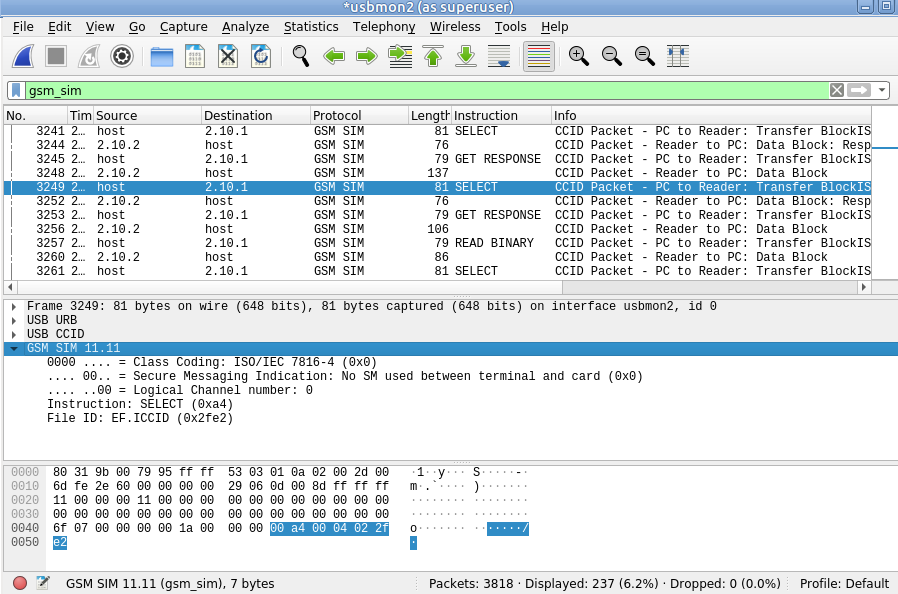
Again, we’ll select the data part of the USBCCID traffic -> Decode As -> GSM_SIM
And bingo, just like that we can now filter by gsm_sim and see the APDUs being sent / received.
IPsec ESP can be used in 3 different ways on the Gm interface between the Ue and the P-CSCF:
Integrity Protection – To prevent tampering
Ciphering – To prevent inception / eavesdropping
Integrity Protection & Ciphering
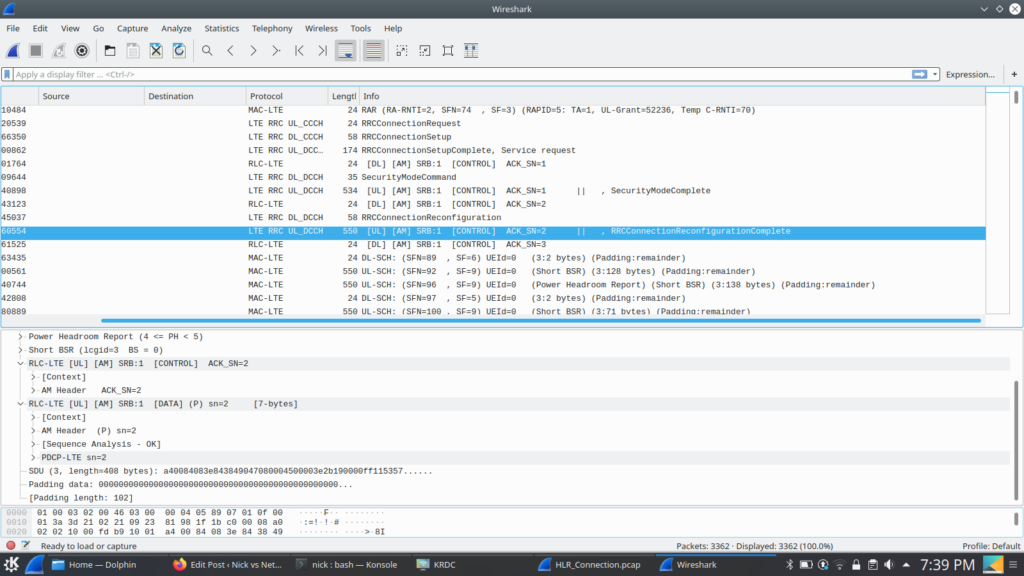
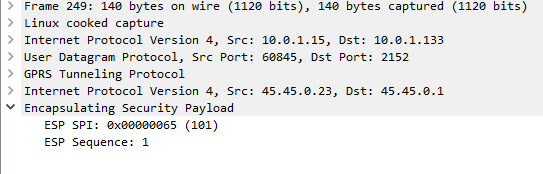
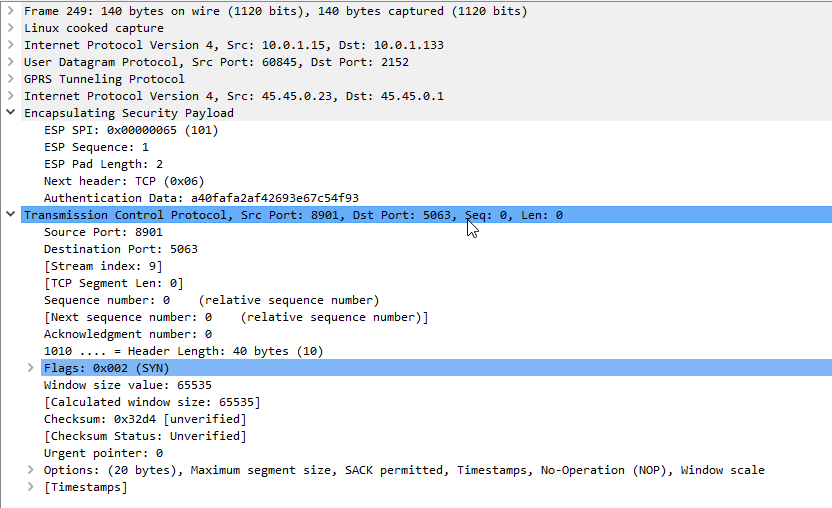
On Wireshark, you’ll see the ESP, but you won’t see the payload contents, just the fact it’s an Encapsulated Security Payload, it’s SPI and Sequence number.
By default, Kamailio’s P-CSCF only acts in Integrity Protection mode, meaning the ESP payloads aren’t actually encrypted, with a few clicks we can get Wireshark to decode this data;
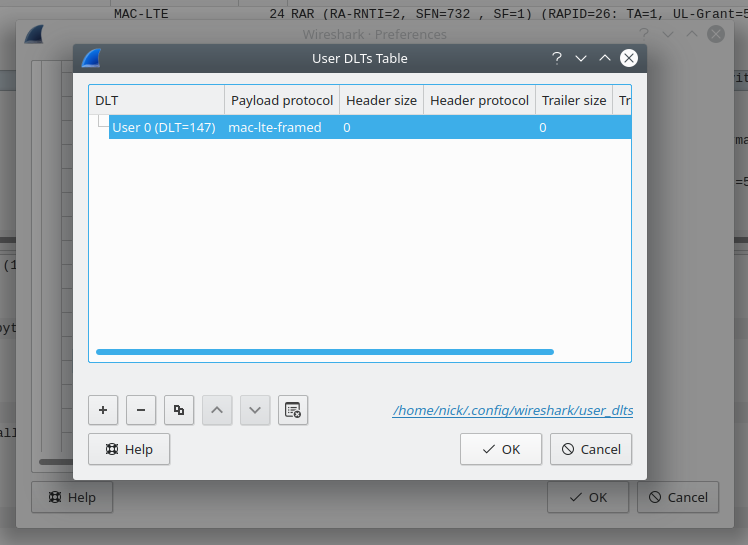
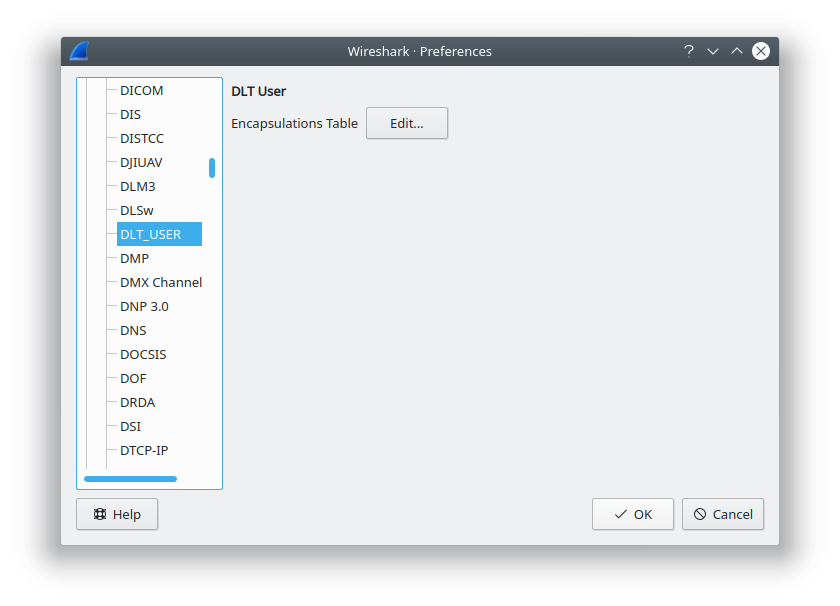
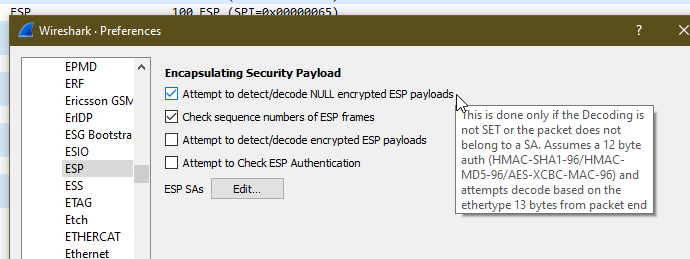
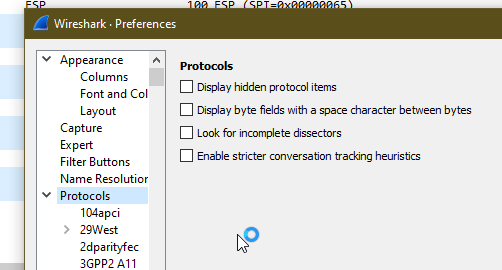
Just open up Wireshark Preferences, expand Protocols and jump to ESP
Now we can set the decoding preferences for our ESP payloads,
In our case we’ll tick the “Attempt to detect/decode NULL encrypted ESP payloads” box and close the box by clicking OK button.
Now Wireshark will scan through all the frames again, anything that’s an ESP payload it will attempt to parse.
Now if we go back to the ESP payload with SQN 1 I showed a screenshot of earlier, we can see the contents are a TCP SYN.
Now we can see what’s going on inside this ESP data between the P-CSCF and the UE!
As a matter of interest if you can see the IK and CK values in the 401 response before they’re stripped you can decode encrypted ESP payloads from Wireshark, from the same Protocol -> ESP section you can load the Ciphering and Integrity keys used in that session to decrypt them.