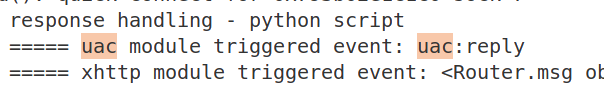
Recently we were debugging a slow memory leak in a little-used Kamailio module.
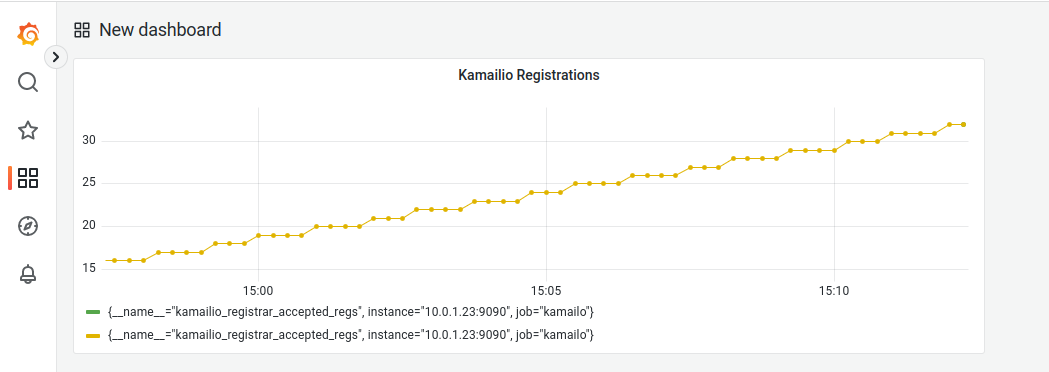
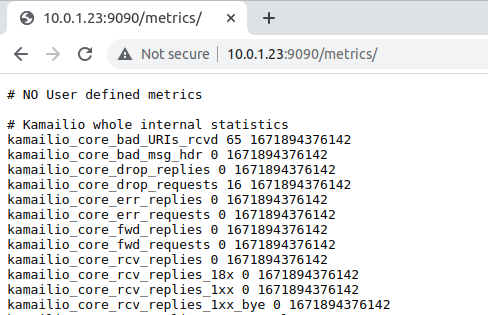
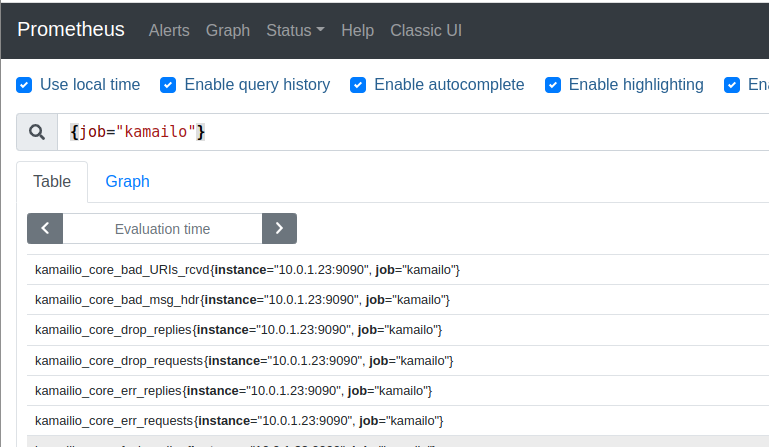
For a long time we’ve used the Kamailio Prometheus exporter to export stats from Kamailio and then Grafana to visualize the metrics.
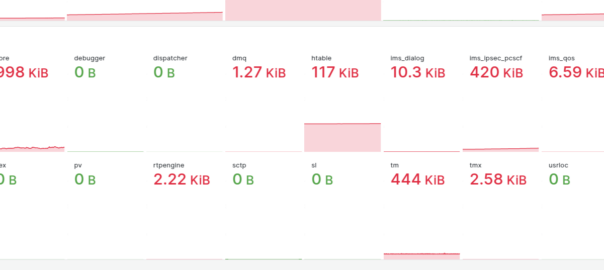
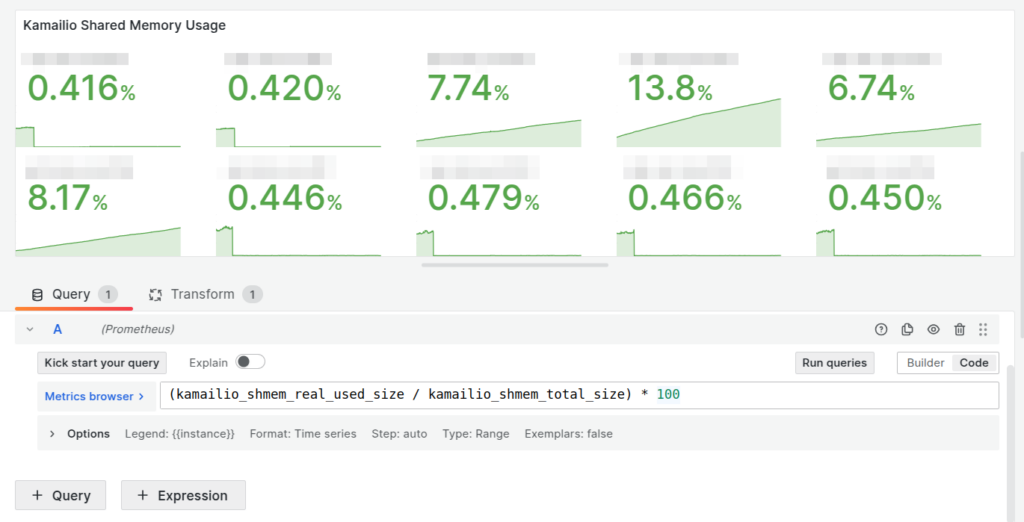
And one of the things we track per box is the shared memory (shm) usage inside Kamailio:
(kamailio_shmem_real_used_size / kamailio_shmem_total_size) * 100Our dashboards showed this slow memory leak, with the memory slowly ticking up on a certain group of machines, we knew there was a memory leak, but in which Kamailio module?
So we know there’s a memory leak on some boxes (different boxes run different modules) but which ones?
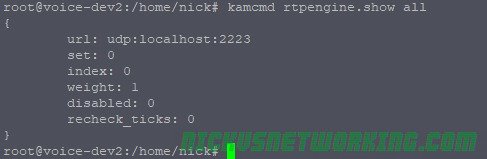
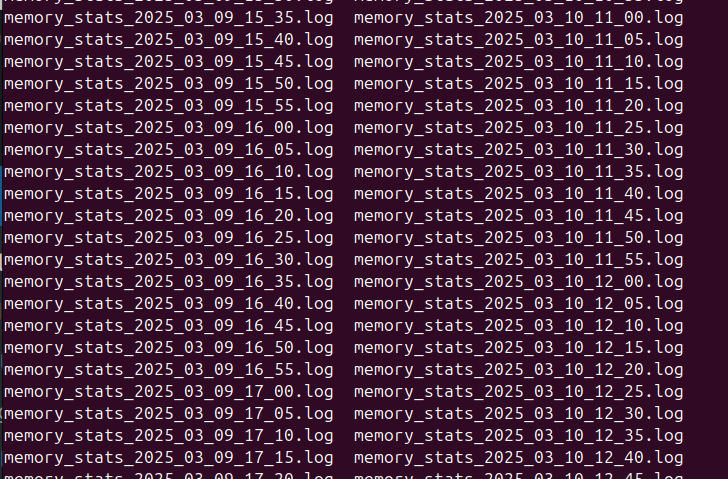
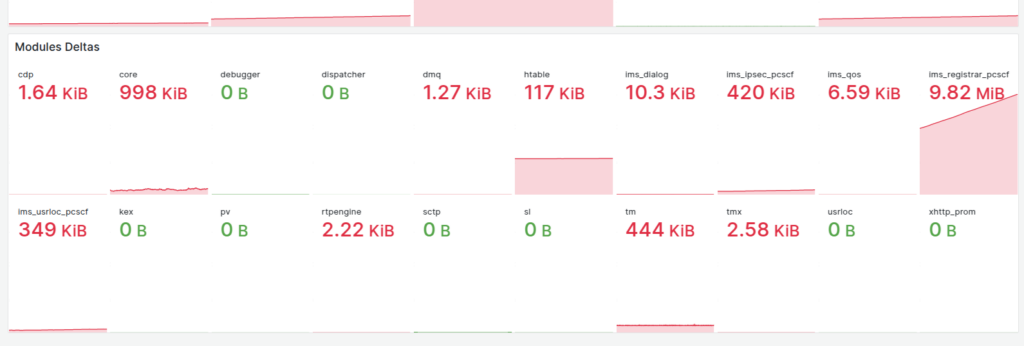
kamcmd will show you a breakdown of the shared memory usage per module, so I started with a little cronjob to dump the data every so often, with the idea I would diff the values and look for big increases.
*/5 * * * * kamcmd mod.stats all shm > /home/nickj/memory_stats_$(date +\%Y_\%m_\%d_\%H_\%M).log
Then the idea of processing the data from the files started to scare me.
So in the end I went overboard and wrote a little script to get the memory usage of each module and export it via Prometheus, so I can track down what module is at fault.
If I were a better C programmer I’d have added this into the main Kamailio Prometheus module, but I’m terrible at C.
I’ve put the code on Github here.
With it I was able to setup this:
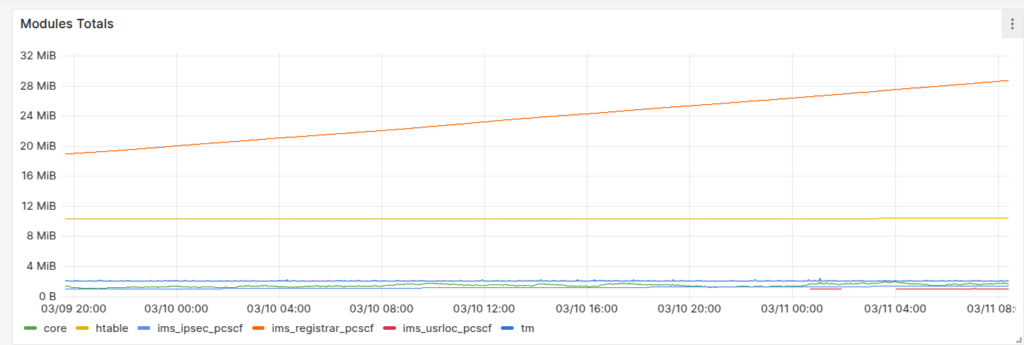
Yeap, that’s our problem, here’s the deltas, that module has grown by ~10Mb in 24 hours.
Now to fix the problem…
If anyone else finds this useful I’ve also posted the source for the Grafana Dashboard here.