For the past few months I’ve had a Band 78 NR active antenna unit sitting next to my desk.
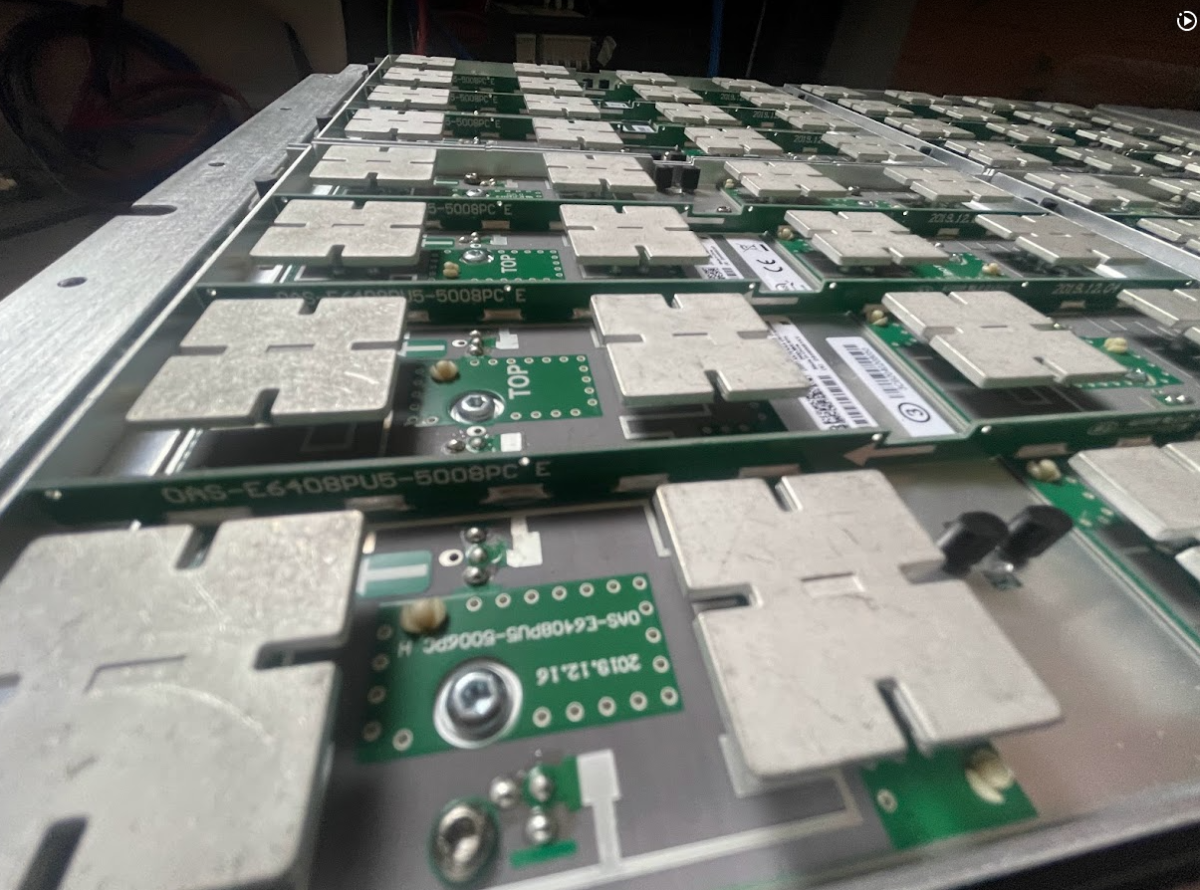
It’s a very cool bit of kit that doesn’t get enough love, but I thought I’d pop open the radome and take a peek inside.
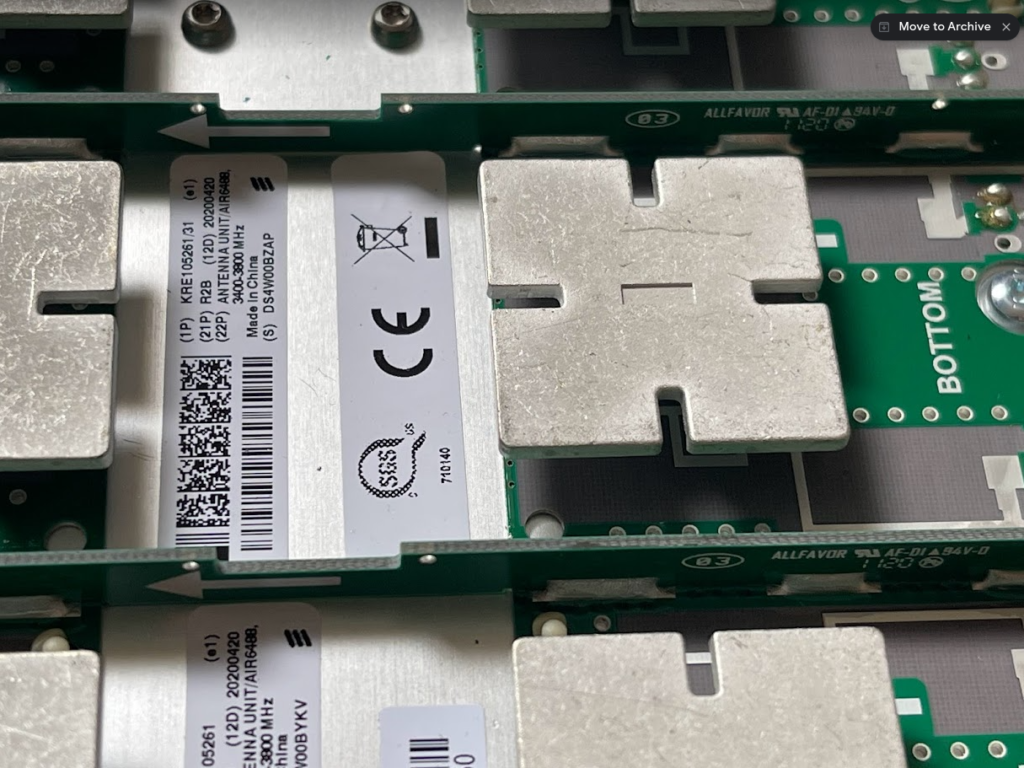
Individual antenna elements
What I found very interesting is that it’s not all antennas in there!
… 29, 30, 31, 32. Yup. Checks out.
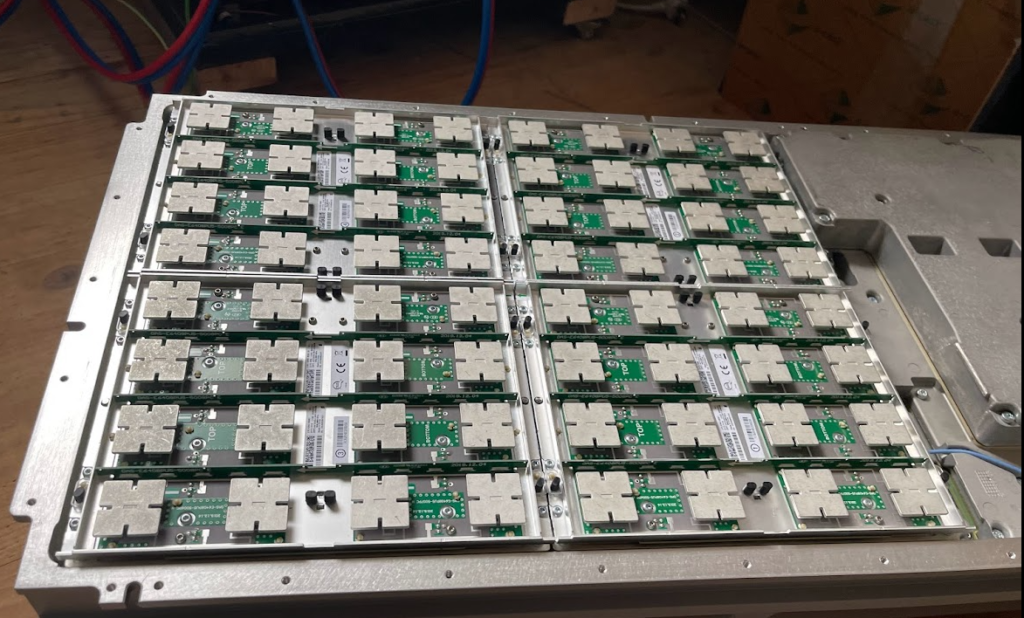
There are the expected number of antennas (I mean if I opened it up and found 31 antennas I’d have been surprised) but they don’t take up the whole volume of the unit, only about half,
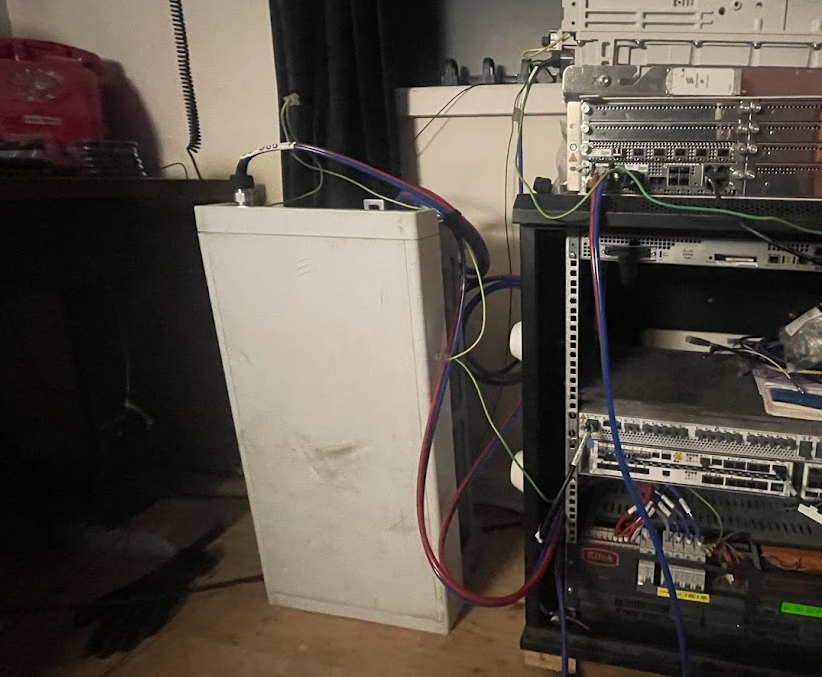
AAU with Radome reinstalled
Well, after that strip show, back to sitting in my office until I need to test something 5G SA again…
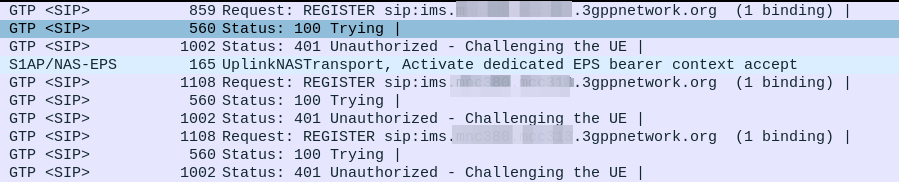
Everything was working on the IMS, then I go to bed, the next morning I fire up the test device and it just won’t authenticate to the IMS – The S-CSCF generated a 401 in response to the REGISTER, but the next REGISTER wouldn’t pass.
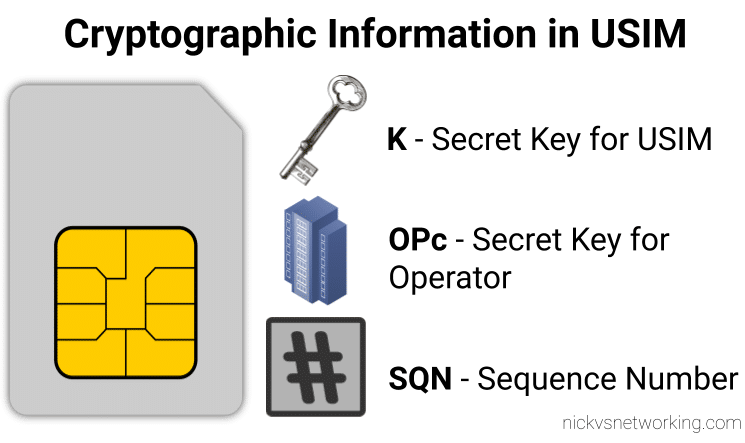
When we generate the vectors (for IMS auth and standard auth) one of the inputs to generate the vectors is the Sequence Number or SQN.
This SQN ticks over like an odometer for the number of times the SIM / HSS authentication process has been performed.
There is some leeway in the SQN – It may not always match between the SIM and the HSS and that’s to be expected. When the MME sends an Authentication-Information-Request it can ask for multiple vectors so it’s got some in reserve for the next time the subscriber attaches, and that’s allowed.
But there are limits to how far out our SQN can be, and for good reason – One of the key purposes for the SQN is to protect against replay attacks, where the same vector is replayed to the UE. So the SQN on the HSS can be ahead of the SIM (within reason), but it can’t be behind – Odometers don’t go backwards.
So the issue was with the SQN on the SIM being out of Sync with the SQN in the IMS, how do we know this is the case, and how do we fix this?
Well there is a resync mechanism so the SIM can securely tell the HSS what the current SQN it is using, so the HSS can update it’s SQN.
When verifying the AUTN, the client may detect that the sequence numbers between the client and the server have fallen out of sync. In this case, the client produces a synchronization parameter AUTS, using the shared secret K and the client sequence number SQN. The AUTS parameter is delivered to the network in the authentication response, and the authentication can be tried again based on authentication vectors generated with the synchronized sequence number.
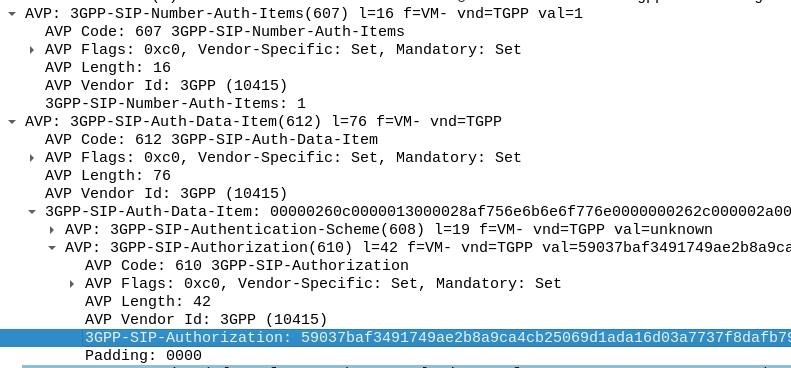
In our example we can tell the sub is out of sync as in our Multimedia Authentication Request we see the SIP-Authorization AVP, which contains the AUTS (client synchronization parameter) which the SIM generated and the UE sent back to the S-CSCF. Our HSS can use the AUTS value to determine the correct SQN.
SIP-Authorization AVP in the Multimedia Authentication Request means the SQN is out of Sync and this AVP contains the RAND and AUTN required to Resync
Note: The SIP-Authorization AVP actually contains both the RAND and the AUTN concatenated together, so in the above example the first 32 bytes are the AUTN value, and the last 32 bytes are the RAND value.
So the HSS gets the AUTS and from it is able to calculate the correct SQN to use.
Then the HSS just generates a new Multimedia Authentication Answer with a new vector using the correct SQN, sends it back to the IMS and presto, the UE can respond to the challenge normally.
We’re doing more and more network automation, and something that came up as valuable to us would be to have all the IPs in HOMER SIP Capture come up as the hostnames of the VM running the service.
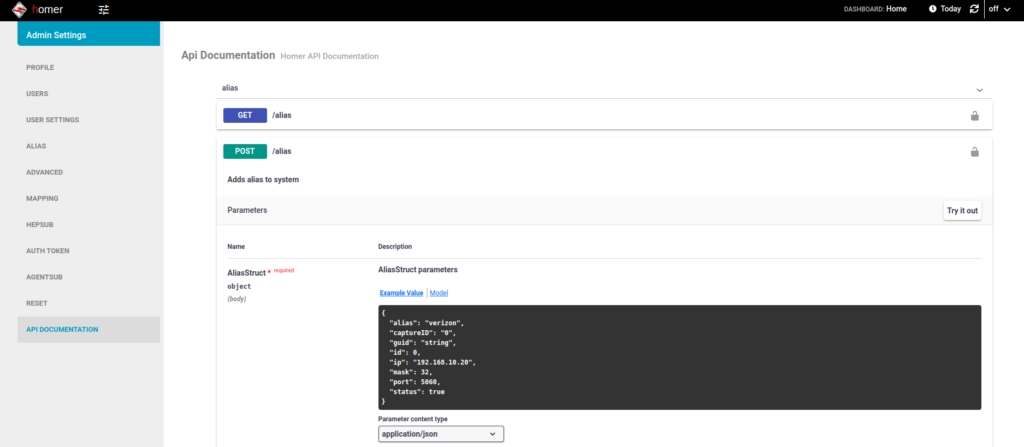
Luckily for us HOMER has an API for this ready to roll, and best of all, it’s Swagger based and easily documented (awesome!).
(Probably through my own failure to properly RTFM) I was struggling to work out the correct (current) way to Authenticate against the API service using a username and password.
Because the HOMER team are awesome however, the web UI for HOMER, is just an API client.
This means to look at how to log into the API, I just needed to fire up Wireshark, log into the Web UI via my browser and then flick through the packets for a real world example of how to do this.
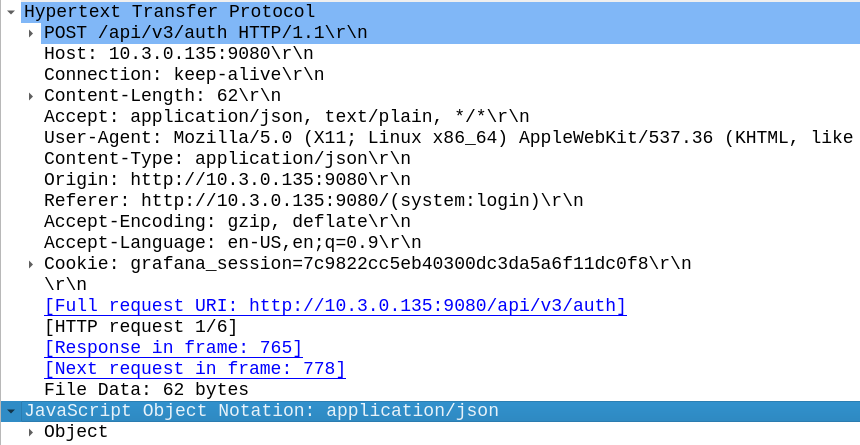
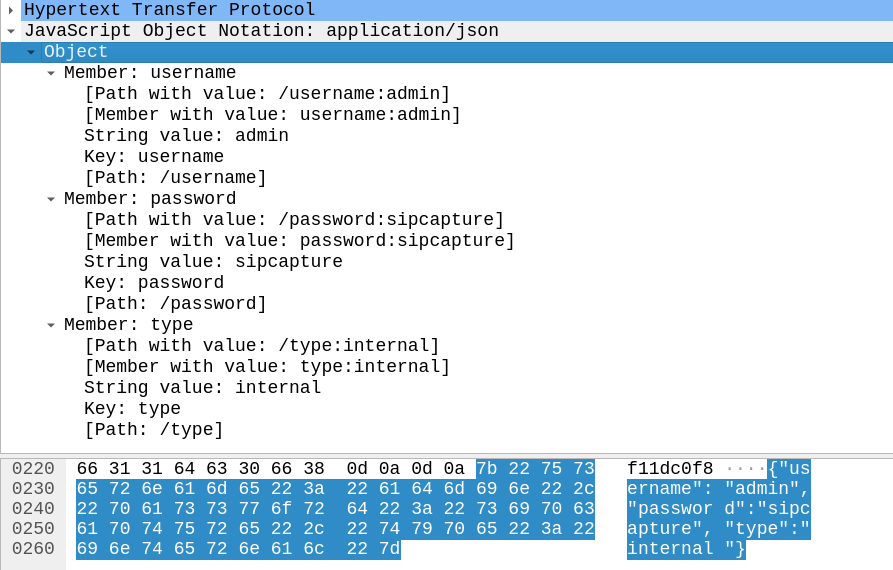
Homer Login JSON body as seen by Wireshark
In the Login action I could see the browser posts a JSON body with the username and password to /api/v3/auth
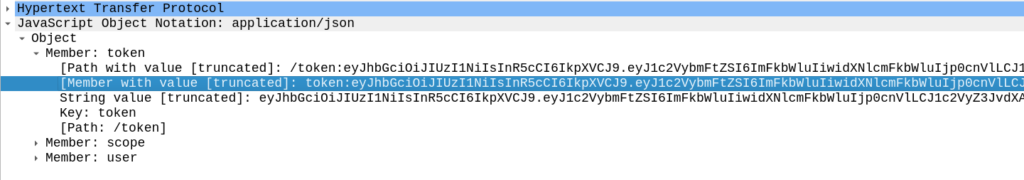
And in return the Homer API Server responds with a 201 Created an a auth token back:
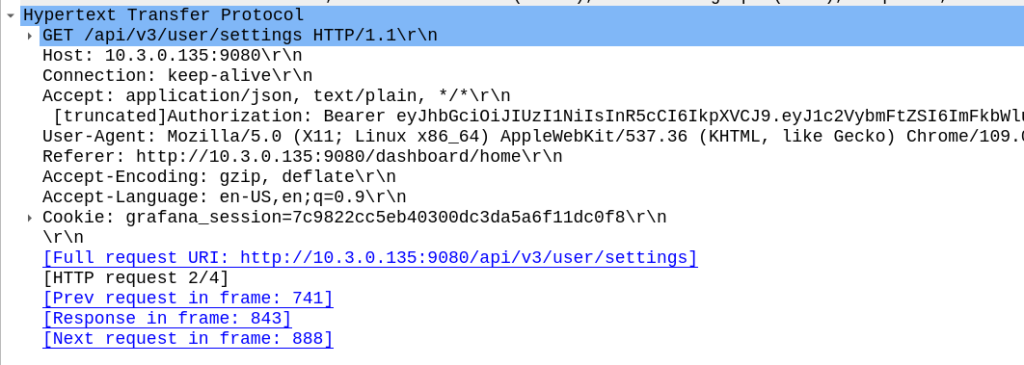
Now in order to use the API we just need to include that token in our Authorization: header then we can hit all the API endpoints we want!
For me, the goal we were setting out to achieve was to setup the aliases from our automatically populated list of hosts. So using the info above I setup a simple Python script with Requests to achieve this:
import requests
s = requests.Session()

#Login and get Token
url = 'http://homer:9080/api/v3/auth'
json_data = {"username":"admin","password":"sipcapture"}
x = s.post(url, json = json_data)
print(x.content)
token = x.json()['token']
print("Token is: " + str(token))


#Add new Alias
alias_json = {
          "alias": "Blog Example",
          "captureID": "0",
          "id": 0,
          "ip": "1.2.3.4",
          "mask": 32,
          "port": 5060,
          "status": True
        }

x = s.post('http://homer:9080/api/v3/alias', json = alias_json, headers={'Authorization': 'Bearer ' + token})
print(x.status_code)
print(x.content)


#Print all Aliases
x = s.get('http://homer:9080/api/v3/alias', headers={'Authorization': 'Bearer ' + token})
print(x.json())
And bingo we’re done, a new alias defined.
We wrapped this up in a for loop for each of the hosts / subnets we use and hooked it into our build system and away we go!
With the Homer API the world is your oyster in terms of functionality, all the features of the Web UI are exposed on the API as the Web UI just uses the API (something I wish was more common!).
Using the Swagger based API docs you can see examples of how to achieve everything you need to, and if you ever get stuck, just fire up Wireshark and do it in the Homer WebUI for an example of how the bodies should look.
Misunderstood, under appreciated and more capable than people give it credit for, is our PCRF.
But what does it do?
Most folks describe the PCRF in hand wavy-terms – “it does policy and charging” is the answer you’ll get, but that doesn’t really tell you anything.
So let’s answer it in a way that hopefully makes some practical sense, starting with the acronym “PCRF” itself, it stands for Policy and Charging Rules Function, which is kind of two functions, one for policy and one for rules, so let’s take a look at both.
Policy
In cellular world, as in law, policy is the rules.
For us some examples of policy could be a “fair use policy” to limit customer usage to acceptable levels, but it can also be promotional packages, services like “free Spotify” packages, “Voice call priority” or “unmetered access to Nick’s Blog and maximum priority” packages, can be offered to customers.
All of these are examples of policy, and to make them work we need to target which subscribers and traffic we want to apply the policy to, and then apply the policy.
Charging Rules
Charging Rules are where the policy actually gets applied and the magic happens.
It’s where we take our policy and turn it into actionable stuff for the cellular world.
Let’s take an example of “unmetered access to Nick’s Blog and maximum priority” as something we want to offer in all our cellular plans, to provide access that doesn’t come out of your regular usage, as well as provide QCI 5 (Highest non dedicated QoS) to this traffic.
To achieve this we need to do 3 things:
Profile the traffic going to this website (so we capture this traffic and not regular other internet traffic)
Charge it differently – So it’s not coming from the subscriber’s regular balance
Up the QoS (QCI) on this traffic to ensure it’s high priority compared to the other traffic on the network
So how do we do that?
Profiling Traffic
So the first step we need to take in providing free access to this website is to filter out traffic to this website, from the traffic not going to this website.
Let’s imagine that this website is hosted on a single machine with the IP 1.2.3.4, and it serves traffic on TCP port 443. This is where IPFilterRules (aka TFTs or “Traffic Flow Templates”) and the Flow-Description AVP come into play. We’ve covered this in the past here, but let’s recap:
IPFilterRules are defined in the Diameter Base Protocol (IETF RFC 6733), where we can learn the basics of encoding them,
They take the format:
action dir proto from src to dst
The action is fairly simple, for all our Dedicated Bearer needs, and the Flow-Description AVP, the action is going to be permit. We’re not blocking here.
The direction (dir) in our case is either in or out, from the perspective of the UE.
Next up is the protocol number (proto), as defined by IANA, but chances are you’ll be using 17 (UDP) or 6 (TCP).
The from value is followed by an IP address with an optional subnet mask in CIDR format, for example from 10.45.0.0/16would match everything in the 10.45.0.0/16 network.
Following from you can also specify the port you want the rule to apply to, or, a range of ports.
Like the from, the tois encoded in the same way, with either a single IP, or a subnet, and optional ports specified.
And that’s it!
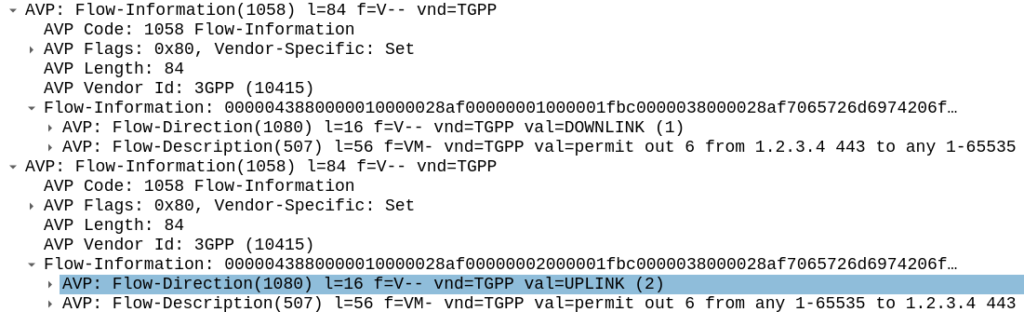
So let’s create a rule that matches all traffic to our website hosted on 1.2.3.4 TCP port 443,
permit out 6 from 1.2.3.4 443 to any 1-65535
permit out 6 from any 1-65535 to 1.2.3.4 443
All this info gets put into the Flow-Information AVPs:
With the above, any traffic going to/from 1.23.4 on port 443, will match this rule (unless there’s another rule with a higher precedence value).
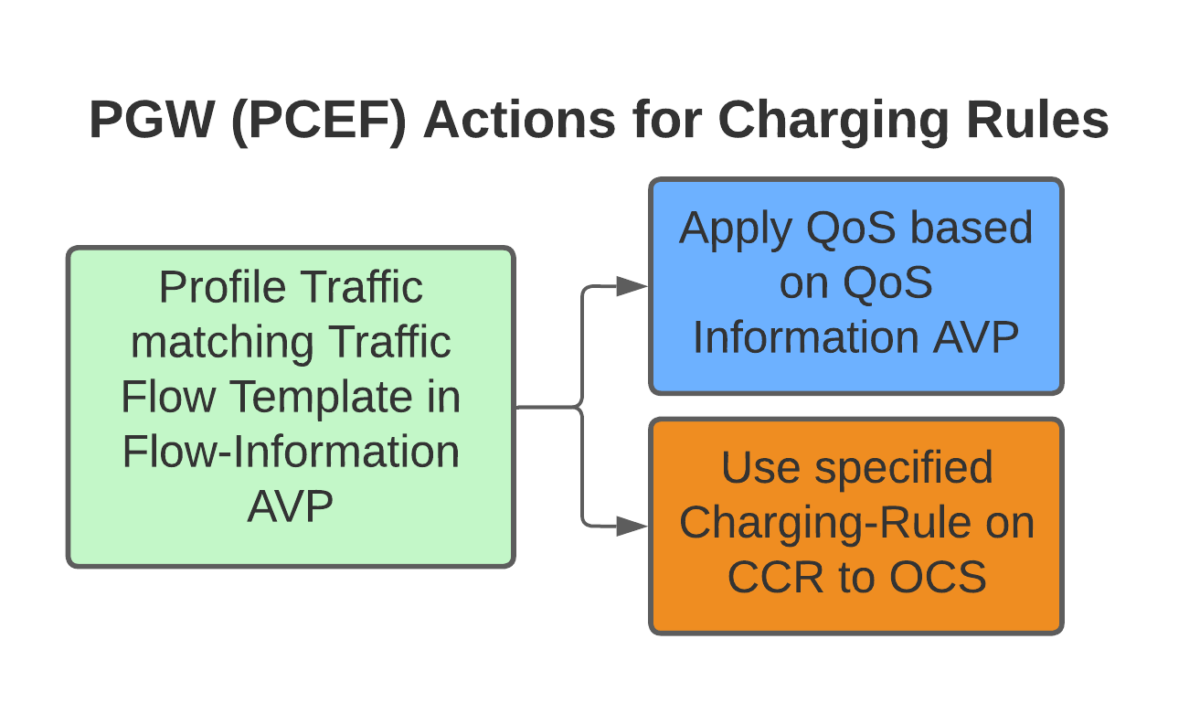
Charging Actions
So with our traffic profiled, the next question is what actions are we going to take, well there’s two, we’re going to provide unmetered access to the profiled traffic, and we’re going to use QCI 4 for the traffic (because you’ll need a guaranteed bit rate bearer to access!).
Charging-Group for Profiled Traffic
To allow for Zero Rating for traffic matching this rule, we’ll need to use a different Rating Group.
Let’s imagine our default rating group for data is 10000, then any normal traffic going to the OCS will use rating group 10000, and the OCS will apply the specific rates and policies based on that.
Rating Groups are defined in the OCS, and dictate what rates get applied to what Rating Groups.
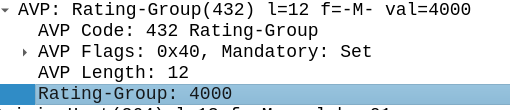
For us, our default rating group will be charged at the normal rates, but we can define a rating group value of 4000, and set the OCS to provide unlimited traffic to any Credit-Control-Requests that come in with Rating Group 4000.
This is how operators provide services like “Unlimited Facebook” for example, a Charging Rule matches the traffic to Facebook based on TFTs, and then the Rating Group is set differently to the default rating group, and the OCS just allows all traffic on that rating group, regardless of how much is consumed.
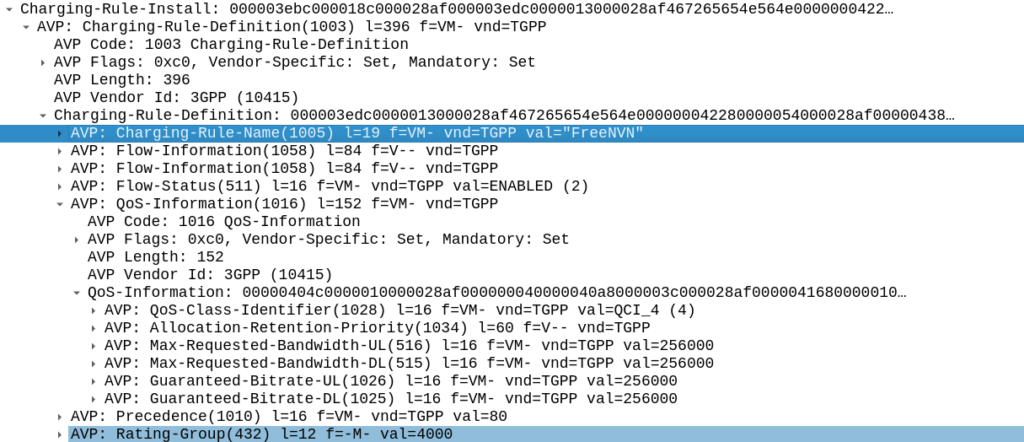
Inside our Charging-Rule-Definition, we populate the Rating-Group AVP to define what Rating Group we’re going to use.
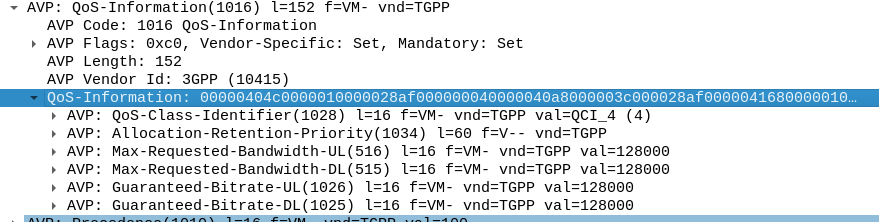
Setting QoS for Profiled Traffic
The QoS Description AVP defines which QoS parameters (QCI / ARP / Guaranteed & Maximum Bandwidth) should be applied to the traffic that matches the rules we just defined.
As mentioned at the start, we’ll use QCI 4 for this traffic, and allocate MBR/GBR values for this traffic.
Putting it Together – The Charging Rule
So with our TFTs defined to match the traffic, our Rating Group to charge the traffic and our QoS to apply to the traffic, we’re ready to put the whole thing together.
So here it is, our “Free NVN” rule:
I’ve attached a PCAP of the flow to this post.
In our next post we’ll talk about how the PGW handles the installation of this rule.
One day recently I was messing with the XCAP server, trying to set the Call Forward timeout. In the process I triggered the UE to send a USSD request to the IMS.
Huh, I thought, “I wonder how hard it would be to build a USSD Gateway for our IMS?”, and this my friends, is the story of how I wasted a good chunk of my weekend trying (and failing) to add support for USSD.
You might be asking “Who still uses USSD?” – The use cases for USSD are pretty thin on the ground in this day and age, but I guess balance query, and uh…
But this is the story of what I tried before giving up and going outside…
Routing
First I’d need to get the USSD traffic towards the USSD Gateway, this means modifying iFCs. Skimming over the spec I can see the Recv-Info: header for USSD traffic should be set to “g.3gpp.ussd” so I knocked up an iFC to match that, and route the traffic to my dev USSD Gateway, and added it to the subscriber profile in PyHSS:
Easy peasy, now we have the USSD requests hitting our USSD Gateway.
The Response
I’ll admit that I didn’t jump straight to the TS doc from the start.
The first place I headed was Google to see if I could find any PCAPs of USSD over IMS/SIP.
And I did – Restcomm seems to have had a USSD product a few years back, and trawling around their stuff provided some reference PCAPs of USSD over SIP.
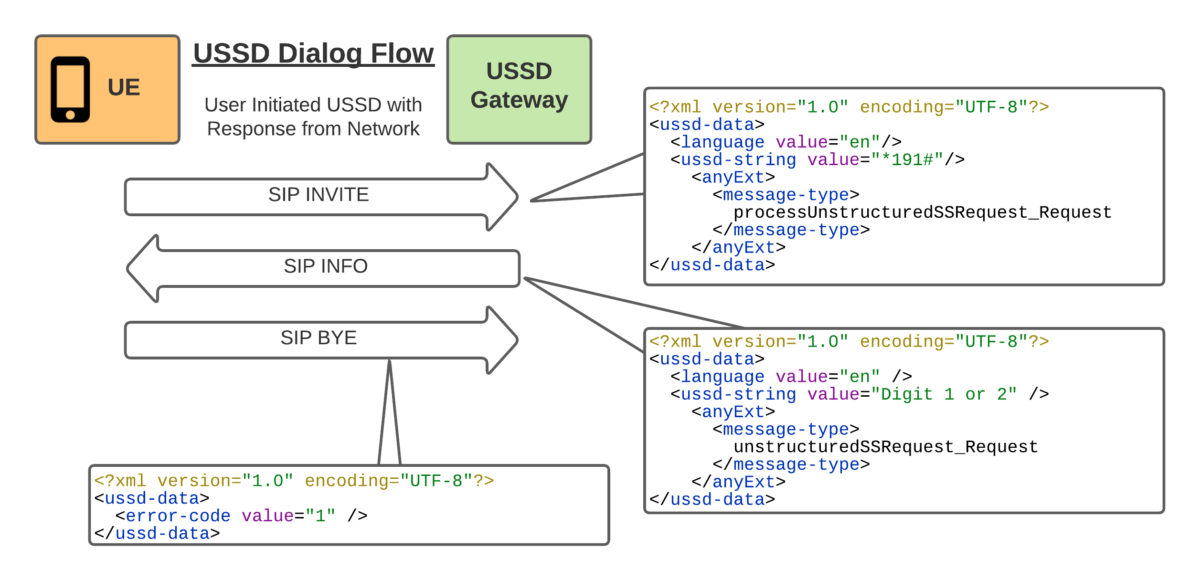
So the flow seemed pretty simple, SIP INVITE to set up the session, SIP INFO for in-dialog responses and a BYE at the end.
With all the USSD guts transferred as XML bodies, in a way that’s pretty easy to understand.
Being a Kamailio fan, that’s the first place I started, but quickly realised that SIP proxies, aren’t great at acting as the UAS.
So I needed to generate in-dialog SIP INFO messages, so I turned to the UAC module to generate the SIP INFO response.
My Kamailio code is super simple, but let’s have a look:
request_route {

        xlog("Request $rm from $fU");

        if(is_method("INVITE")){
                xlog("USSD from $fU to $rU (Emergency number) CSeq is $cs ");
                sl_reply("200", "OK Trying USSD Phase 1");      #Generate 200 OK
                route("USSD_Response"); #Call USSD_Response route block
                exit;
        }
}

route["USSD_Response"]{
        xlog("USSD_Response Route");
        #Generate a new UAC Request
        $uac_req(method)="INFO";
        $uac_req(ruri)=$fu;     #Copy From URI to Request URI
        $uac_req(furi)=$tu;     #Copy To URI to From URI
        $uac_req(turi)=$fu;     #Copy From URI to To URI
        $uac_req(callid)=$ci;   #Copy Call-ID
                                #Set Content Type to 3GPP USSD
        $uac_req(hdrs)=$uac_req(hdrs) + "Content-Type: application/vnd.3gpp.ussd+xml\r\n";
                                #Set the USSD XML Response body
        $uac_req(body)="<?xml version='1.0' encoding='UTF-8'?>
        <ussd-data>
                <language value=\"en\"/>
                <ussd-string value=\"Bienvenido. Seleccione una opcion: 1 o 2.\"/>
        </ussd-data>";
        $uac_req(evroute)=1;    #Set the event route to use on return replies
        uac_req_send();         #Send it!
}
So the UAC module generates the 200 OK and sends it back.
“That was quick” I told myself, patting myself on the back before trying it out for the first time.
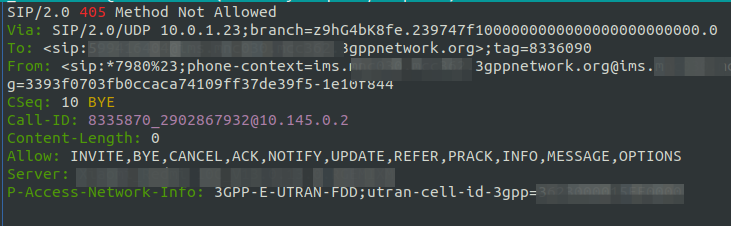
Huston, we have a problem – Although the Call-ID is the same, it’s not an in-dialog response as the tags aren’t present, this means our UE send back a 405 to the SIP INFO.
Right. Perhaps this is the time to read the Spec…
Okay, so the SIP INFO needs to be in dialog. Can we do that with the UAC module? Perhaps not…
But alas real life came back to rear its ugly head, and this adventure will have to continue another day…
Update: Thanks to a kindly provided PCAP I now know what I was doing wrong, and so we’ll soon have a follow up to this post named “Successes in cobbling together a USSD Gateway” just as soon as I have a weekend free.
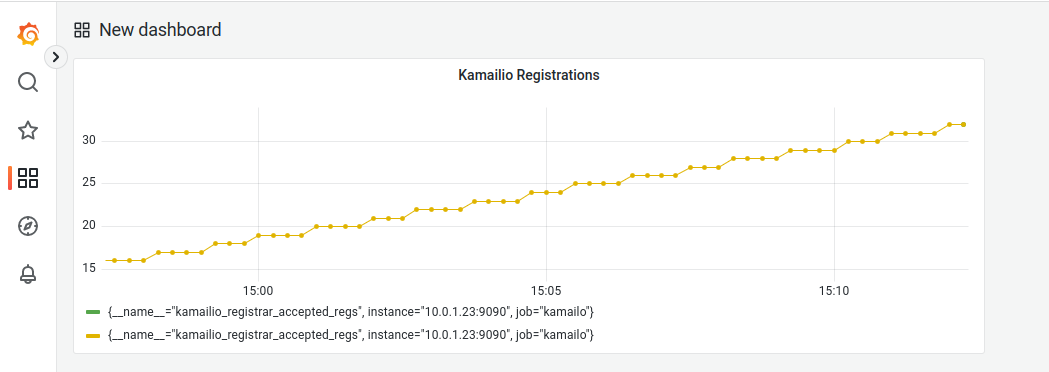
I recently fell in love with the Prometheus + Grafana combo, and I’m including it in as much of my workflow as possible, so today we’ll be integrating this with another favorite – Kamailio.
Why would we want to integrate Kamailio into Prometheus + Grafana? Observability, monitoring, alerting, cool dashboards to make it look like you’re doing complicated stuff, this duo have it all!
I’m going to assume some level of familiarity with Prometheus here, and at least a basic level of understanding of Kamailio (if you’ve never worked with Kamailio before, check out my Kamailio 101 Series, then jump back here).
So what will we achieve today?
We’ll start with the simple SIP Registrar in Kamailio from this post, and we’ll add on the xhttp_prom module, and use it to expose some stats on the rate of requests, and responses sent to those requests.
So to get started we’ll need to load some extra modules, xhttp_prom module requires xhttp (If you’d like to learn the basics of xhttp there’s also a Kamailio Bytes – xHTTP Module post covering the basics) so we’ll load both.
xHTTP also has some extra requirements to load, so in the top of our config we’ll explicitly specify what ports we want to bind to, and set two parameters that control how Kamailio handles HTTP requests (otherwise you’ll not get responses for HTTP GET requests).
Then where you load all your modules we’ll load xhttp and xhttp_prom, and set the basic parameters:
loadmodule "xhttp.so"
loadmodule "xhttp_prom.so"
# Define two counters and a gauge
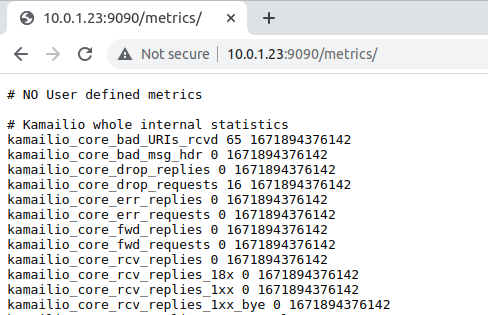
modparam("xhttp_prom", "xhttp_prom_stats", "all")
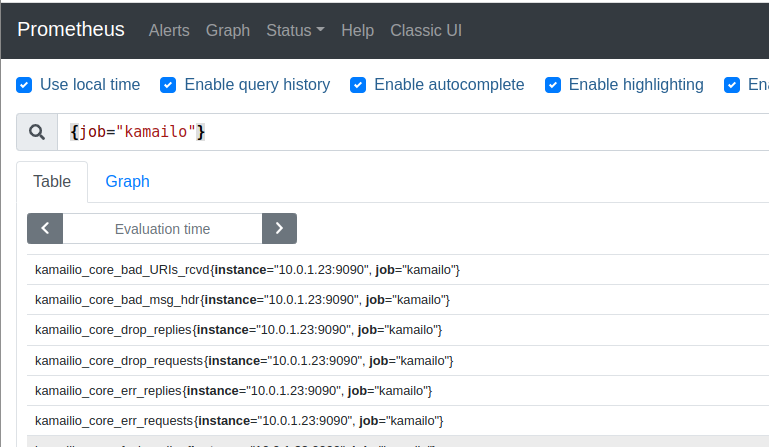
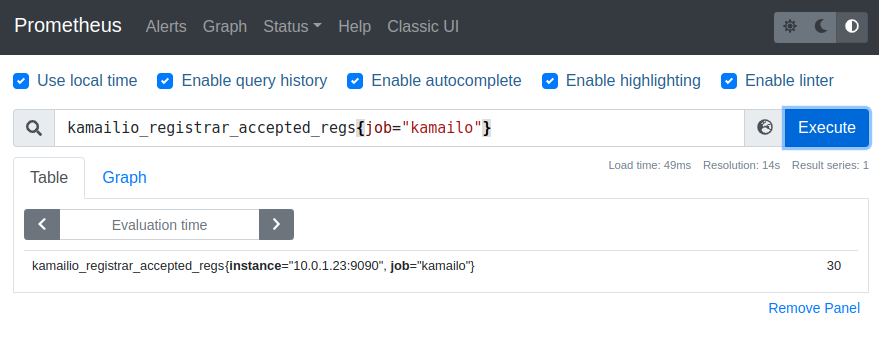
By setting xhttp_prom module to expose all stats, this exposes all of Kamailio’s internal stats as counters to Prometheus – This means we don’t need to define all our own counters / histograms / gauges, instead we can use the built in ones from Kamailio. Of course we can define our own custom ones, but we’ll do that in our next post.
Lastly we’ll need to add an event route to handle HTTP requests to the /metrics URL: