There are a number of ways to feed Homer data, in this case we’re going to use Kamailio, which has a HEP module, so when we feed Kamailio SIP data it’ll use the HEP module to encapsulate it and send it to the database for parsing on the WebUI.
We won’t actually do any SIP routing with Kamailio, we’ll just use it to parse copies of SIP messages sent to it, encapsulate them into HEP and send them to the DB.
We’ll be doing this on the same box that we’re running the HomerUI on, if we weren’t we’d need to adjust the database parameters in Kamailio so it pushes the data to the correct MySQL database.
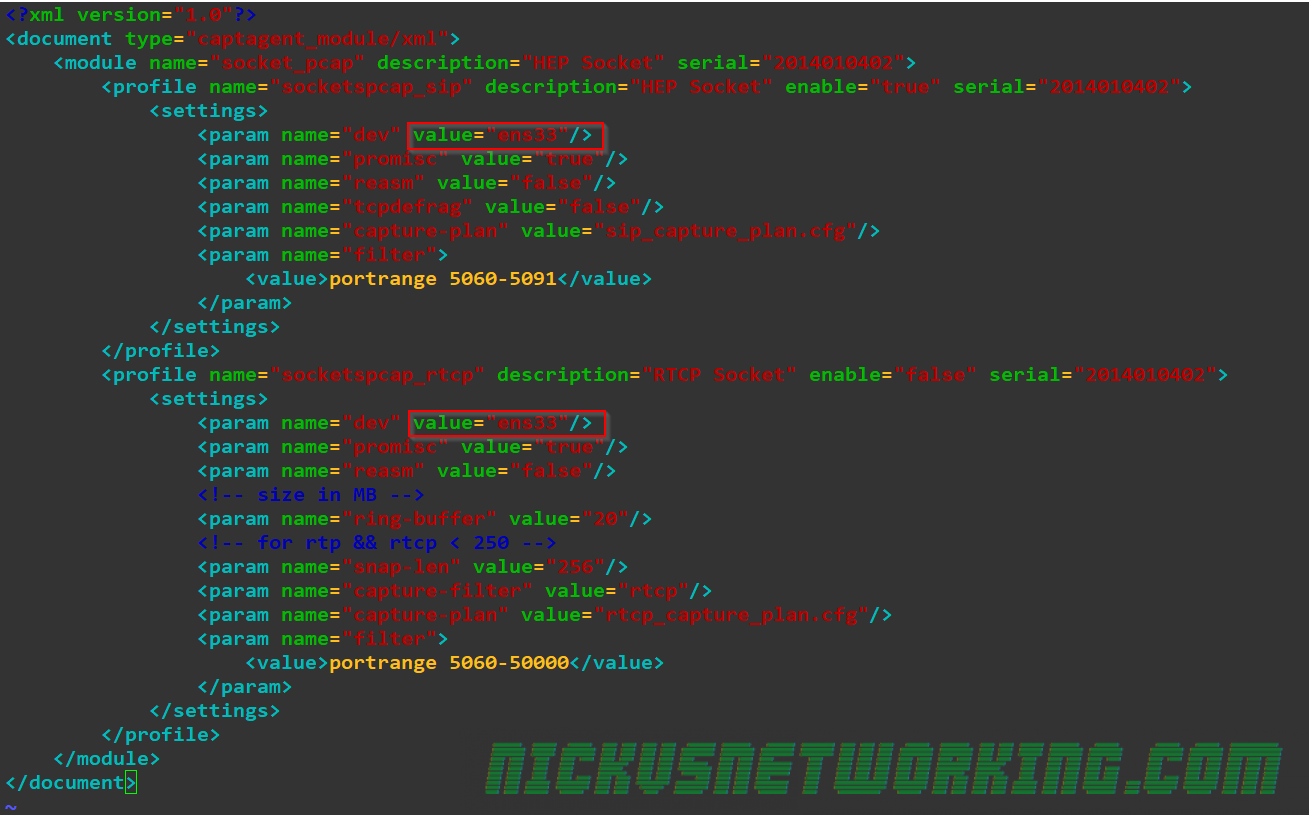
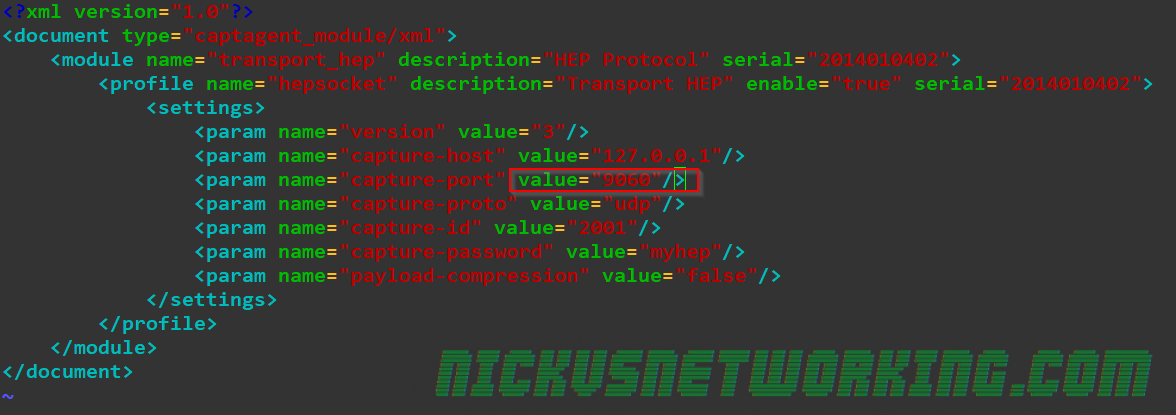
Next we’ll need to configure captagent to capture data and feed it to Kamailio. There’s two things we’ll need to change from the default, the first is the interface we capture on (By default it’s eth0, but Ubuntu uses eth33 as the first network interface ID) and the second is the HEP destination we send our data to (By default it’s on 9061 but our Kamailio instance is listening on 9060).
We’ll start by editing captagent’s socket_pcap.xml file to change the interface we capture on:
vi /etc/captagent/socket_pcap.xml
HOMER Captagent Interface Setup
Next we’ll edit the port that we send HEP data on
vi /etc/captagent/transport_hep.xml
Set HEP Port for Transport
And finally we’ll restart captagent
/etc/init.d/captagent
Now if we send SIP traffic to this box it’ll be fed into HOMER.
In most use cases you’d use a port mirror so you may need to define the network interface that’s the destination of the port mirror in socket_pcap.xml
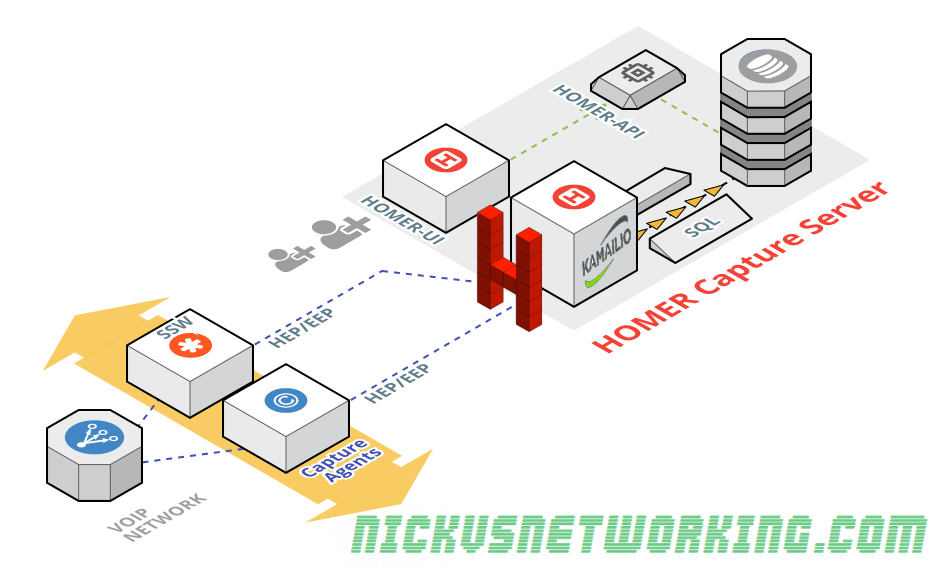
HOMER is a popular open source SIP / RTP debug / recording tool.
It’s architecture is pretty straight forward, we have a series of Capture Agents feeding data into a central HOMER Capture Server, which runs a database (today we’re using MySQL), a Homer-UI (Running on Apache), a Homer-API (Also running on Apache) and a HEP processor, which takes the HEP encoded data from the Capture Agents and runs on Kamailio. (That’s right, I’m back rambling about Kamailio)
So this will get the web interface and DB backend of HOMER setup,
For HOMER to actually work you’ll need to feed it data, in the next tutorial we’ll cover configuring a capture agent to feed the HEP processor (Kamailio) which we’ll also setup, but for now we’ll just setup the web user interface for HOMER, API and Database.
If you, like me, spend a lot of time looking at SIP logs, sngrep is an awesome tool for debugging on remote machines. It’s kind of like if VoIP Monitor was ported back to the days of mainframes & minimal remote terminal GUIs.
Installation
It’s in the Repos for Debian and Ubuntu:
apt-get install sngrep
GUI Usage
sngrep can be used to parse packet captures and create packet captures by capturing off an interface, and view them at the same time.
We’ll start by just calling sngrep on a box with some SIP traffic, and waiting to see the dialogs appear.
Here we can see some dialogs, two REGISTERs and 4 INVITEs.
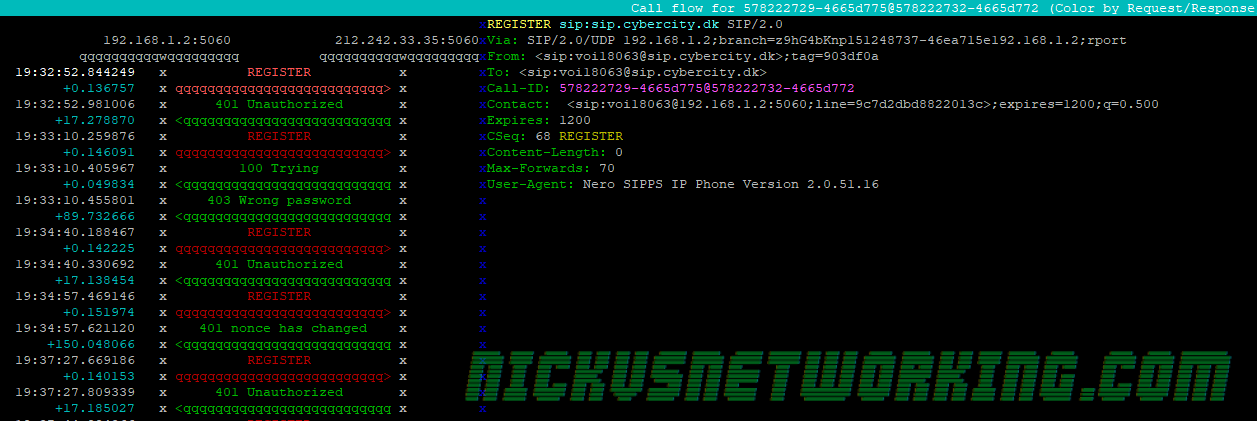
By using the up and down arrow keys we can select a dialog, hitting Enter (Return) will allow us to view that dialog in more detail:
Again we can use the up and down arrow keys to view each of the responses / messages in the dialog.
Hitting Enter again will show you that message in full screen, and hitting Escape will bring you back to the first screen.
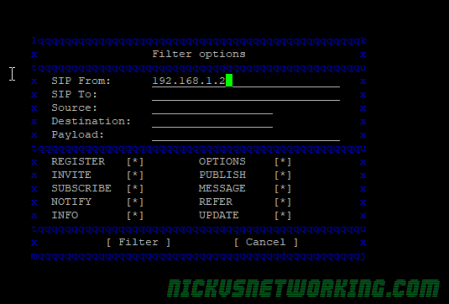
From the home screen you can filter with F7, to find the dialog you’re interested in.
Command Line Parameters
One of the best features about sngrep is that you can capture and view at the same time.
As a long time user of TCPdump, I’d been faced with two options, capture the packets, download them, view them and look for what I’m after, or view it live with a pile of chained grep statements and hope to see what I want.
By adding -O filename.pcap to sngrep you can capture to a packet capture and view at the same time.
You can use expression matching to match only specific dialogs.
Want more telecom goodness?
I have a good old fashioned RSS feed you can subscribe to.