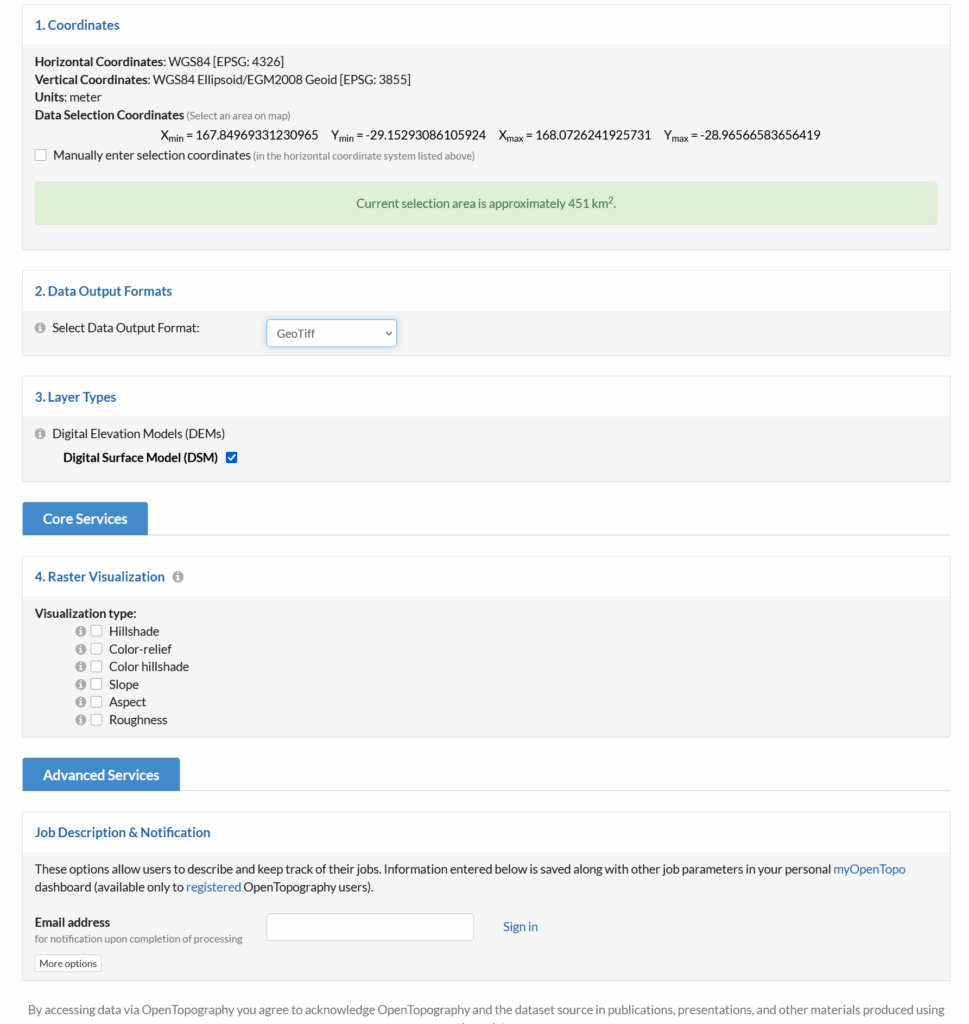
Looks like this is my 3rd (and hopefully final) post on the topic of loading Digital Elevation Models / Topographic data into Forsk Atoll, because this time, we’ve got global data, which allows us to Digital Elevation Models, at 30m resolution, for anywhere on the planet.
The Copernicus DEM is a Digital Surface Model (DSM) which represents the surface of the Earth including buildings, infrastructure and vegetation. This DSM is derived from an edited DSM named WorldDEM, where flattening of water bodies and consistent flow of rivers has been included. In addition, editing of shore- and coastlines, special features such as airports, and implausible terrain structures has also been applied.
The WorldDEM product is based on the radar satellite data acquired during the TanDEM-X Mission, which is funded by a Public Private Partnership between the German State, represented by the German Aerospace Centre (DLR) and Airbus Defence and Space. OpenTopography is providing access to the global GLO-30 Defence Gridded Elevation Data (DGED) 2023_1 version of the data hosted by ESA via the PRISM service. Details on the Copernicus DSM can be found on this ESA site.
This is a tool for a job, 30m resolution is not crazy high – LIDAR scans achieve sub 1m accuracy, but aren’t available everywhere, where as the COP30 dataset is global, meaning we can do RF design for anywhere on the planet.
So how do we get this into Atoll to do RF modeling?
I had to re-project the data, so inside Global Mapper I had to go to Tools -> Configure.
Then change the projection to UTM and use the UTM Zone Finder to find out what zone I needed.
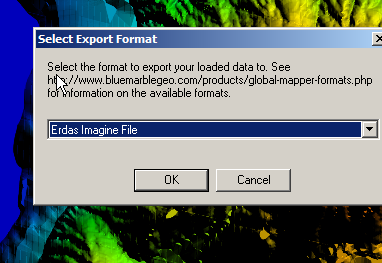
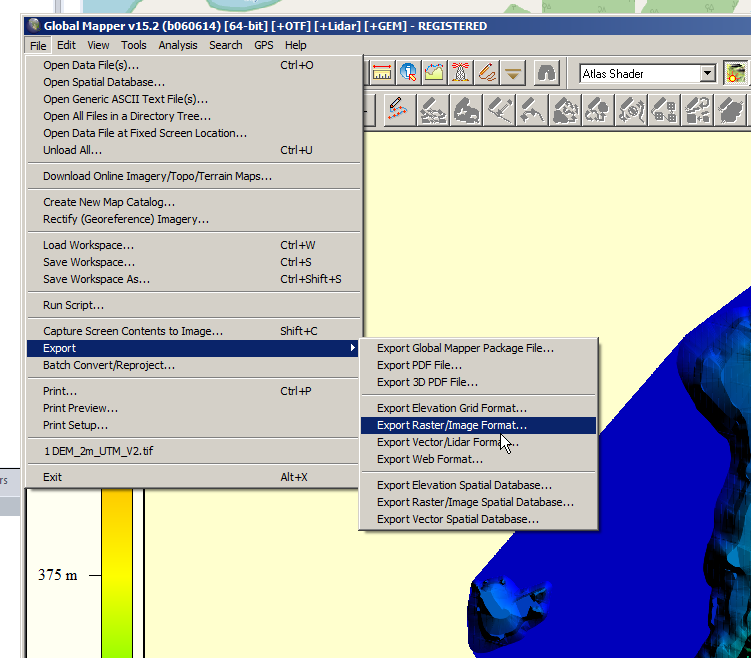
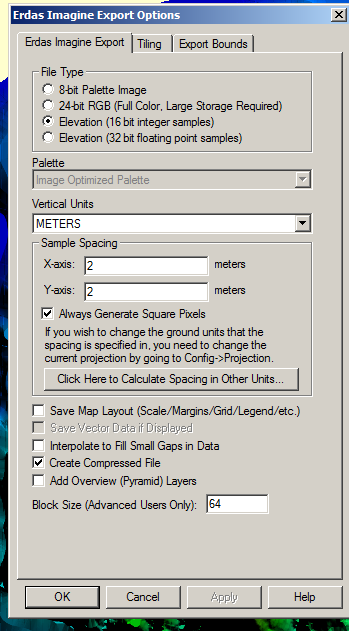
Then I exported the data as an Erdas Imagine file and was able to imported happily into Atoll, after setting the matching projection in Atoll (Which you generally do at the start of the project).
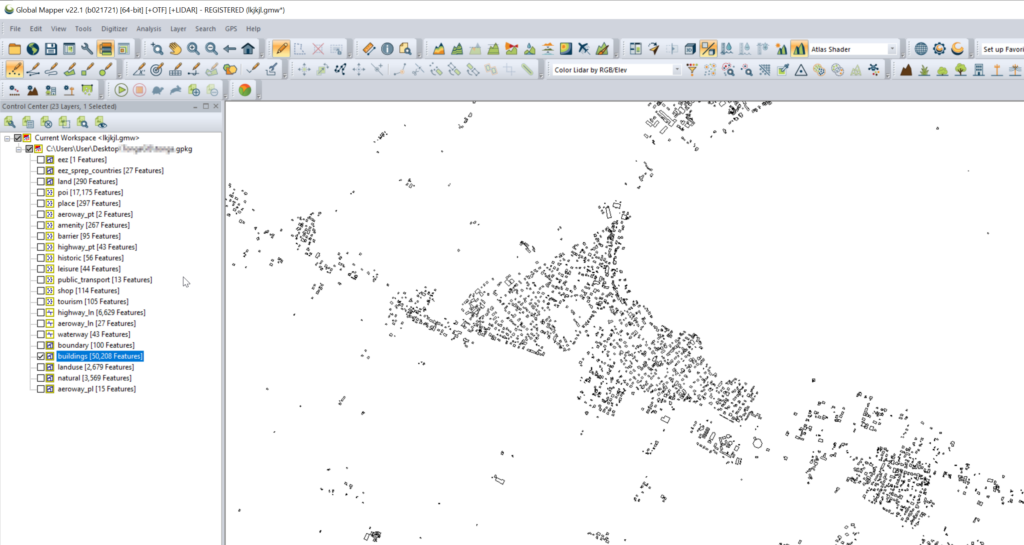
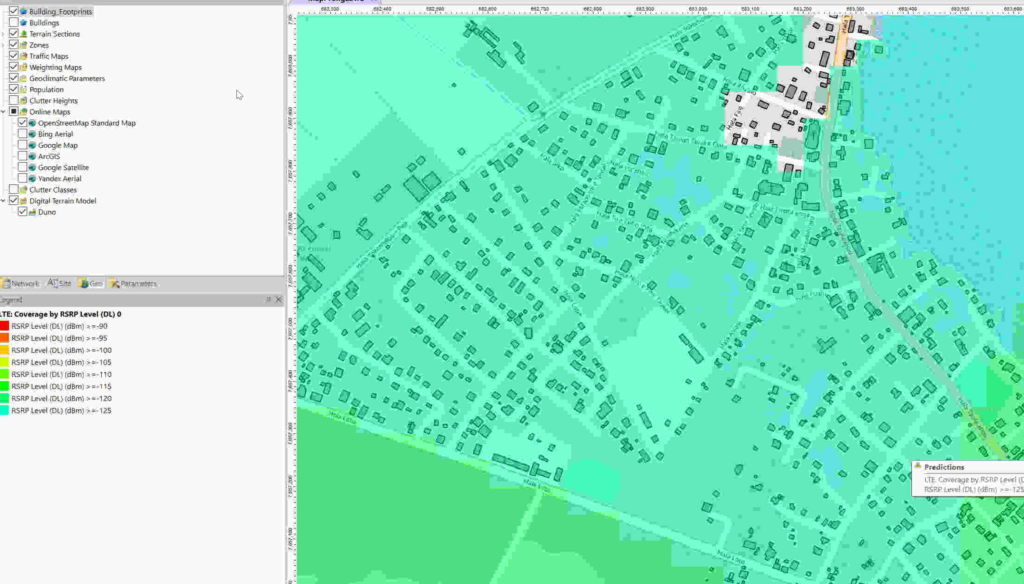
Having building footprints inside Atoll is super-duper valuable, this means you can calculate your percentage of homes / buildings covered, after all geographic coverage and population coverage are two very different things.
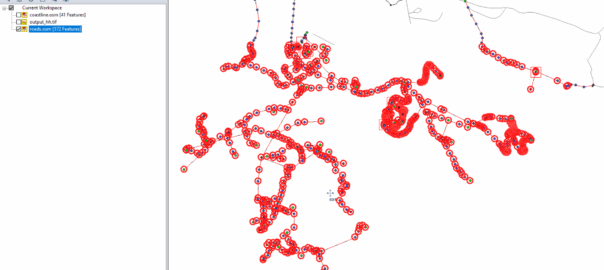
Once you’ve got the export, we’ll load the .gpkg file (or files) into GlobalMapper
Select one layer at a time that you want to export into Atoll. (This also works for roads, geographic boundaries, POIs, etc)
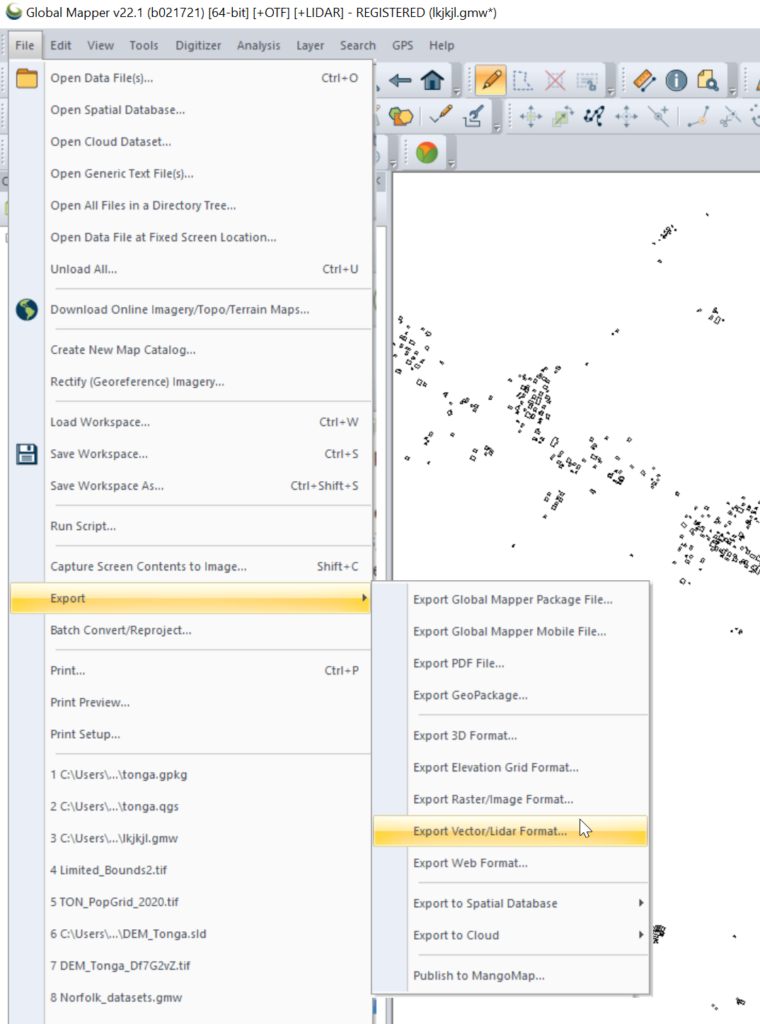
Export the selected layer from Export -> Export Vector / Lidar Format
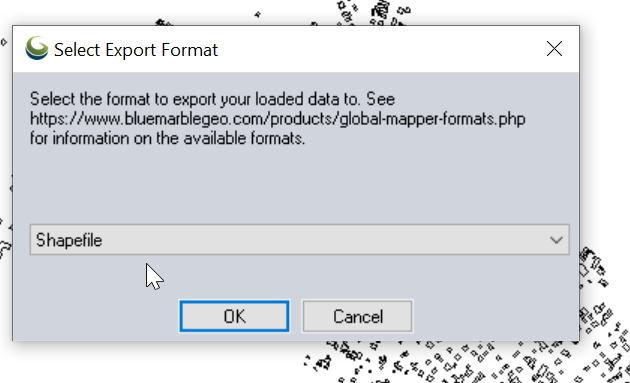
Set output type to “Shapefile”
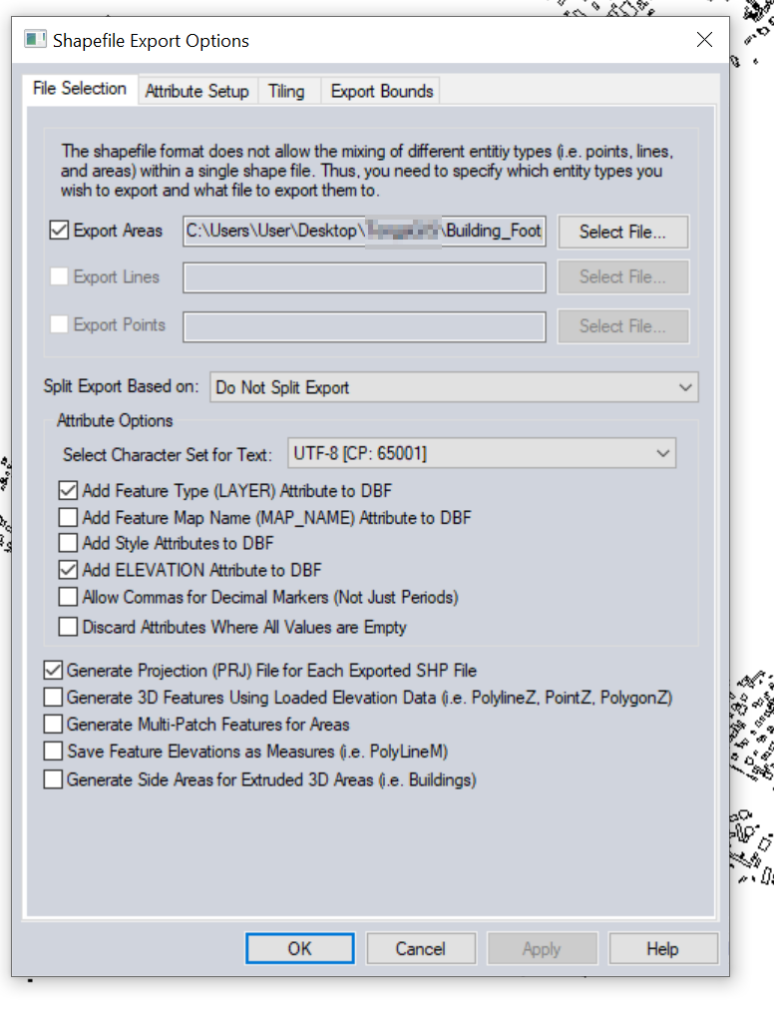
Set output filename in “Export Areas” (This will be the output file). If you want to limit the export to a given area you can do that in Export Bounds.
Now we can import this data into Atoll.
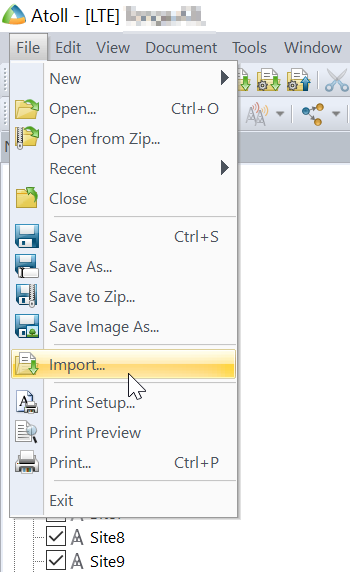
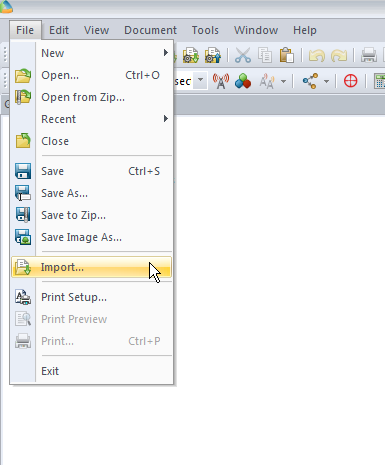
File -> Import
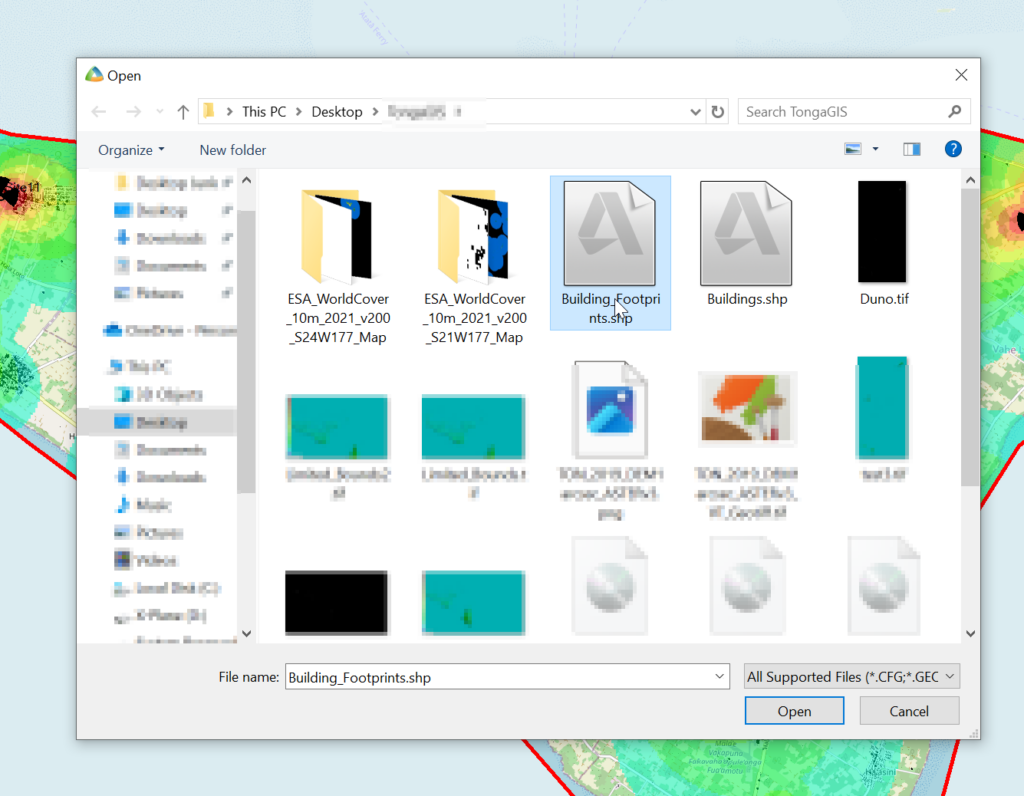
Select the exported Shapefile we just created.
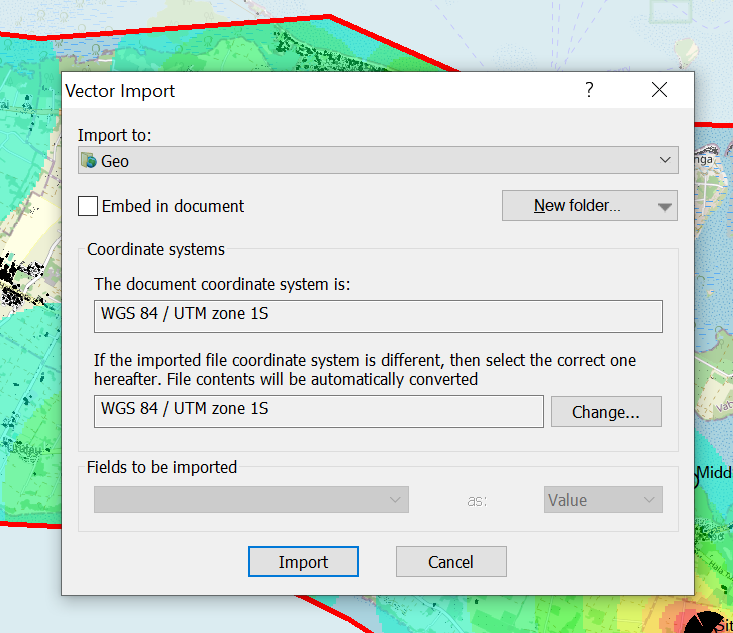
Set the projection and import
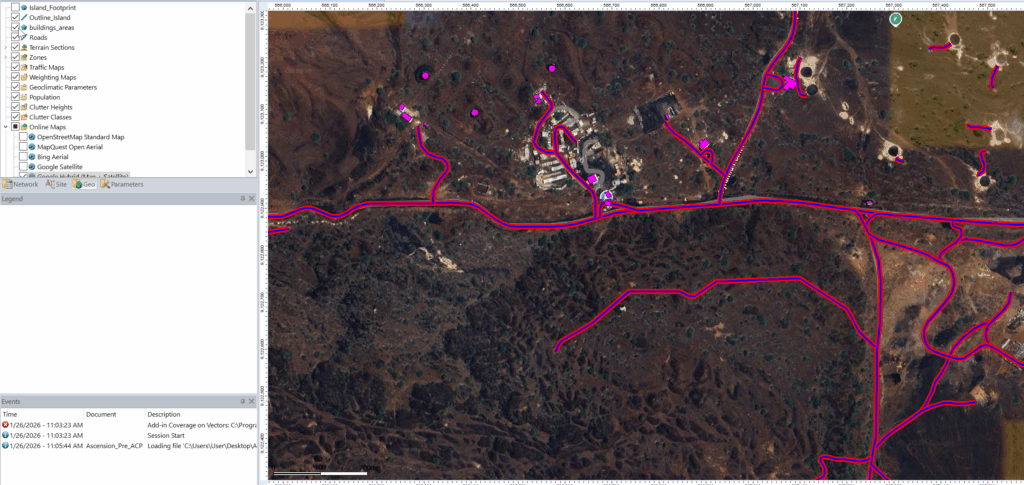
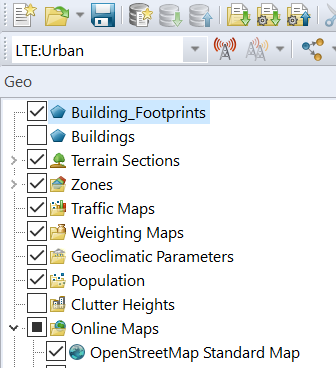
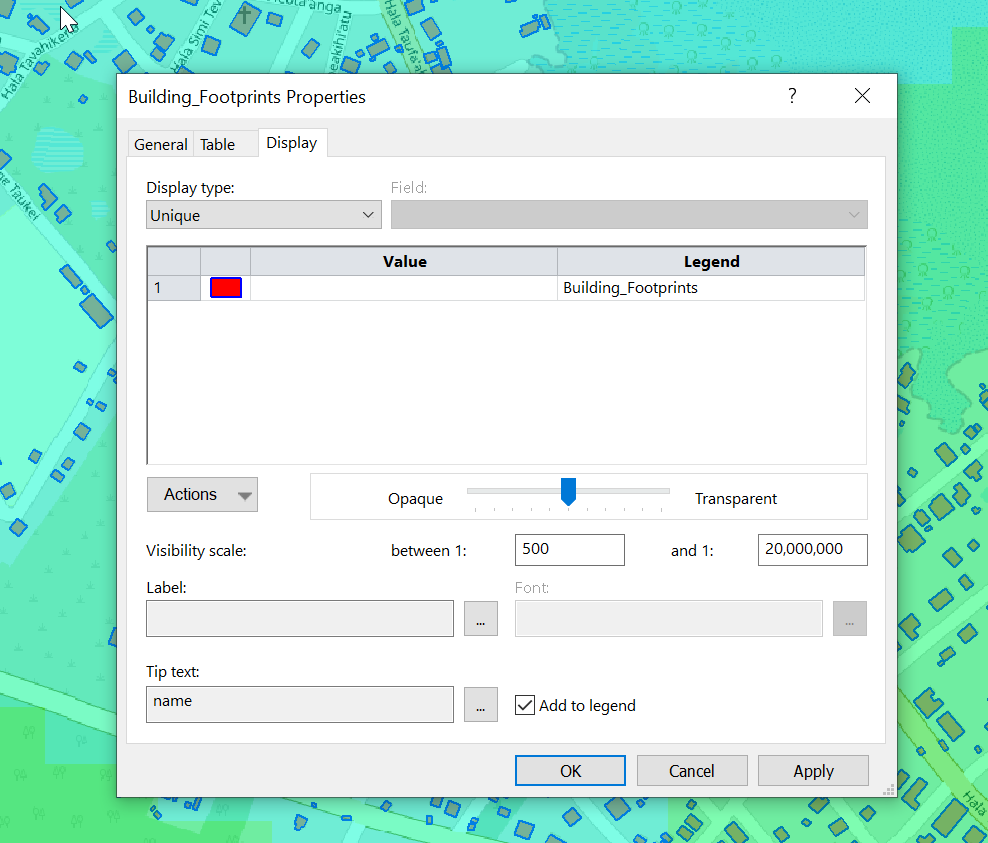
Bingo now we’ve got our building footprints,
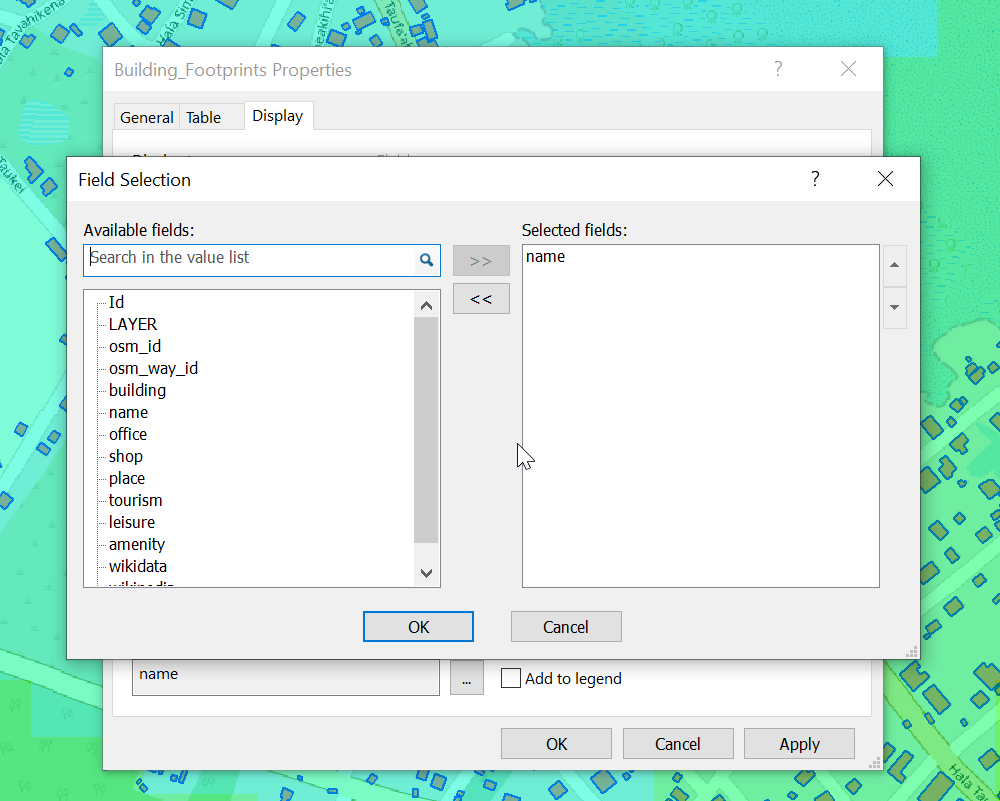
We can change the style of the layer and the labels as needed.
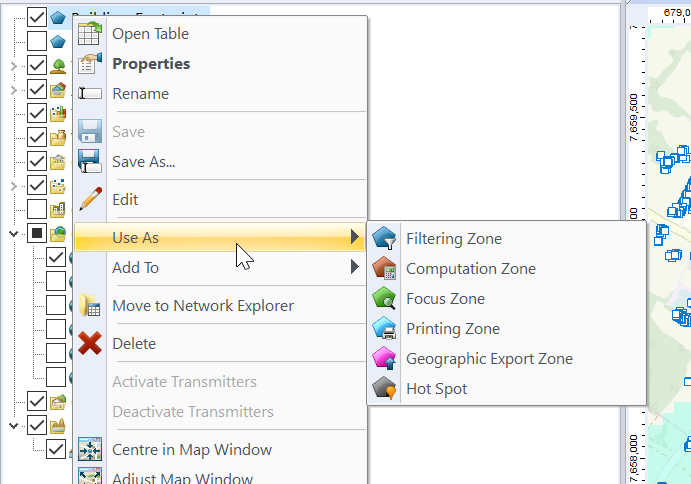
Now we can use the buildings as the Focus Zone / Compute Zone and then run reports and predictions based on those areas.
For example I can run Automatic Cell Planning with the building layers as the Focus zones, to optimize azimuths, tilts and powers to provide coverage to where people live, not just vacant land.
Clutter data describes real world things on the planet’s surface that attenuate signals, for example trees, shrubs, buildings, bodies of water, etc, etc. There’s also different types of trees, some types of trees attenuate signals more than others, different types of buildings are the same.
Getting clutter data used to be crazy expensive, and done on a per country or even per region basis, until the European Space Agency dropped a global dataset free of charge for anyone to use, that covered the entire planet in a single source of data.
So we can use this inside Forsk Atoll for making our predictions.
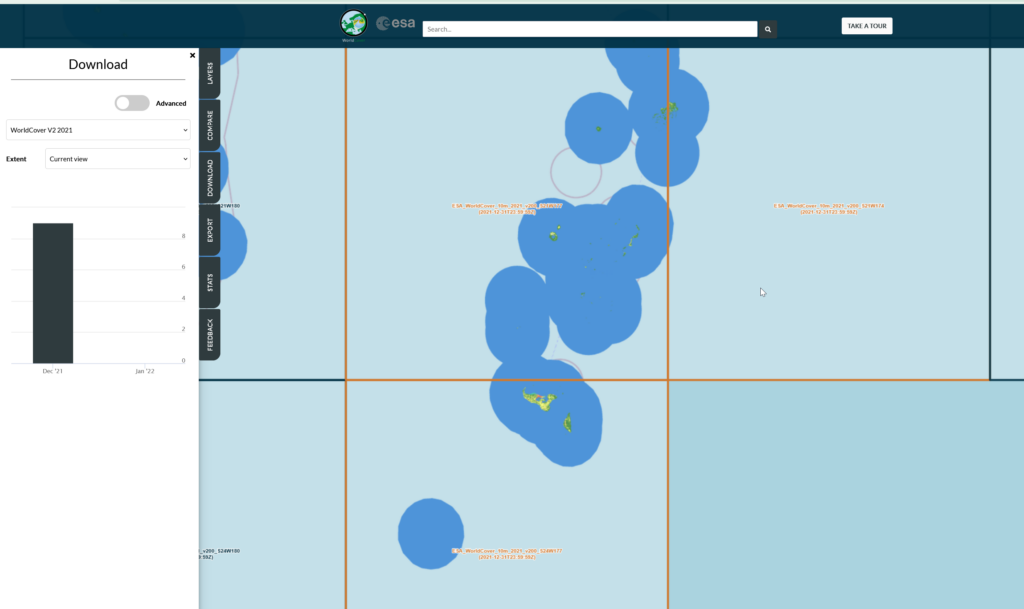
First things first we’ll need to create an account with the ESA (This is not where they take astronaut applications unfortunately, it just gives you access to the datasets).
Then you can select the areas (tiles) you want to download after clicking the “Download” tab on the right.
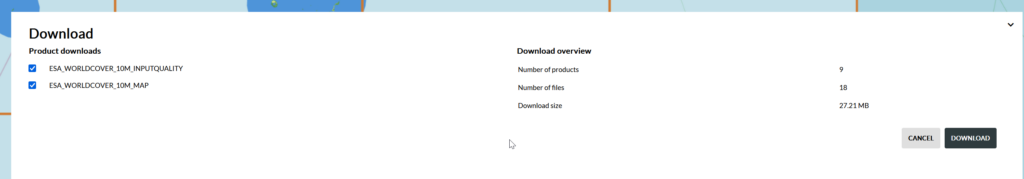
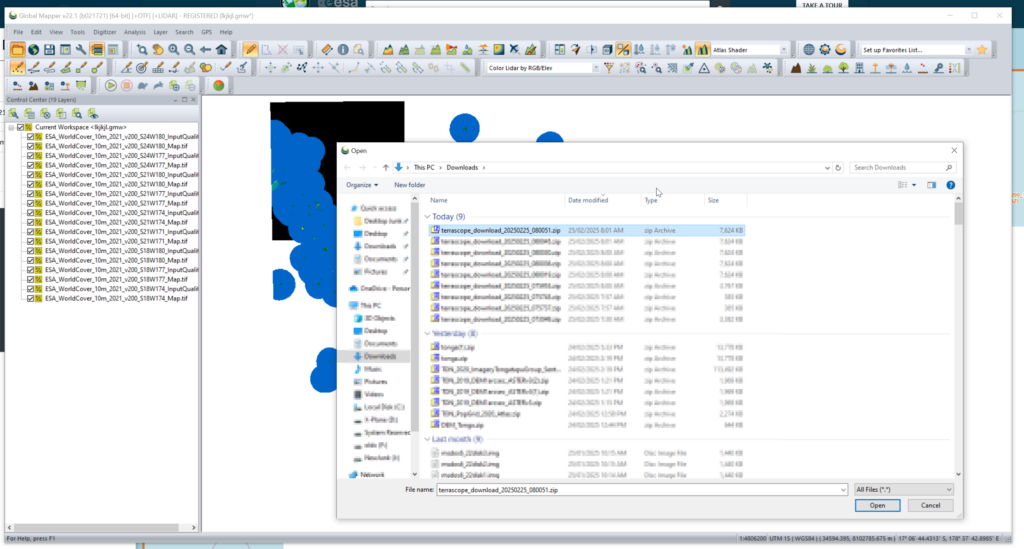
We get a confirmation of the tiles we’re download and we’ll get a ZIP file containing the data.
We can load the whole ZIP file (Without needing to extract anything) into GlobalMapper which loads all the layers.
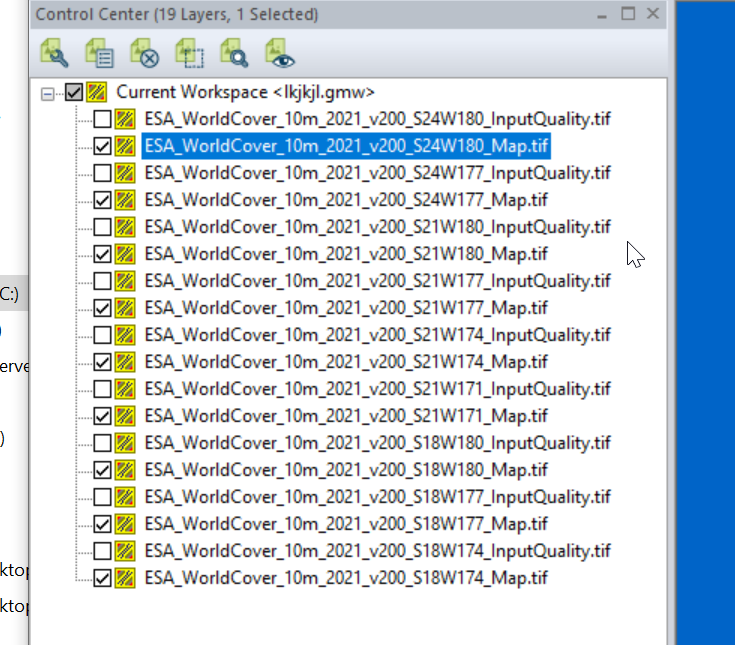
I found the _Map.tif files the highest resolution, so I’m only exporting these.
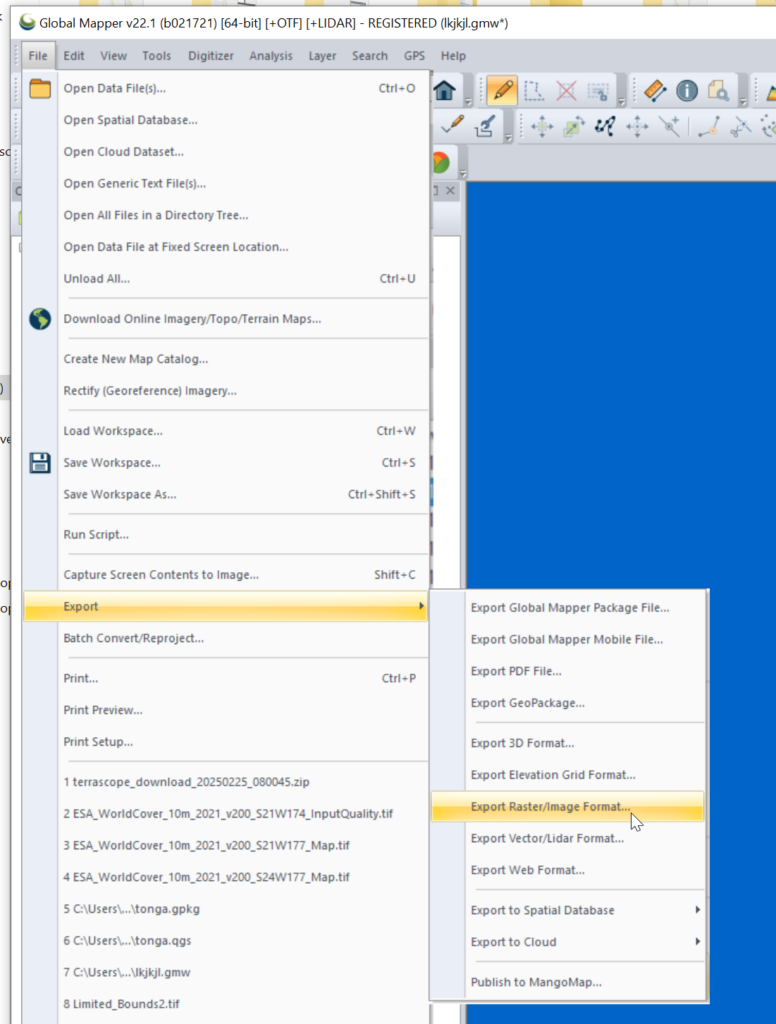
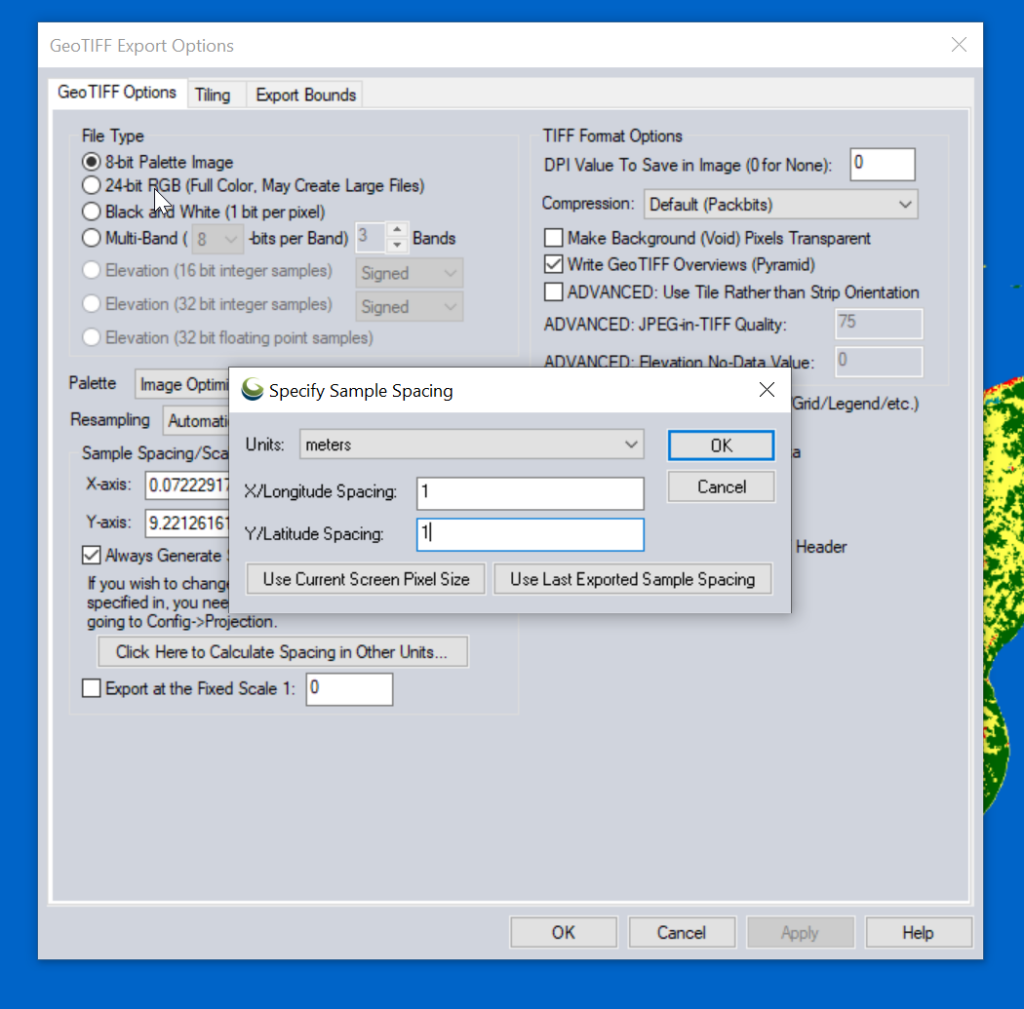
Then we need to export the data to GeoTiff for use in Atoll (The specific GeoTiff format ESA produces them in is not compatible with Atoll hence the need to convert), so we export the layers as Raster / Image format.
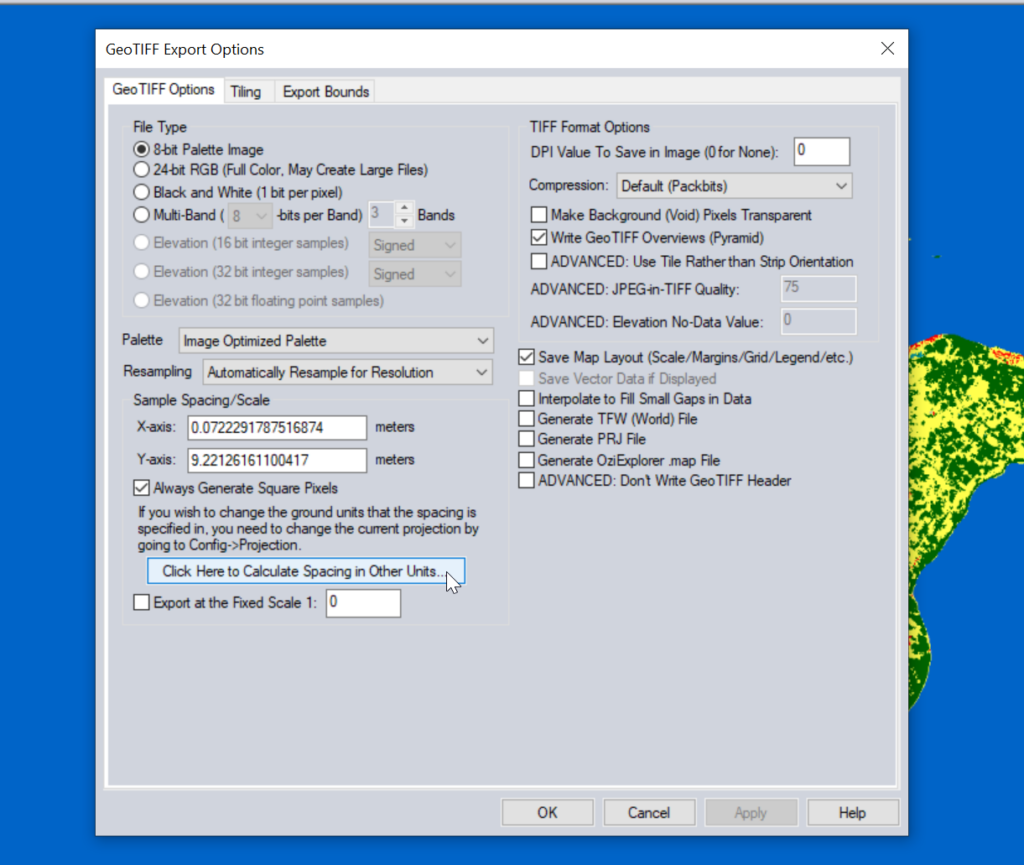
Atoll requires square pixels, and we need them in meters, so we select “Calculate Spacing in Other Units”.
Then set the spacing to meters (I use 1m to match everything else, but the data is actually only 10m accurate, so you could set this to 10m).
You probably want to set the Export Bounds to just the areas you’re interested in, otherwise the data gets really big, really quickly and takes forever to crunch.
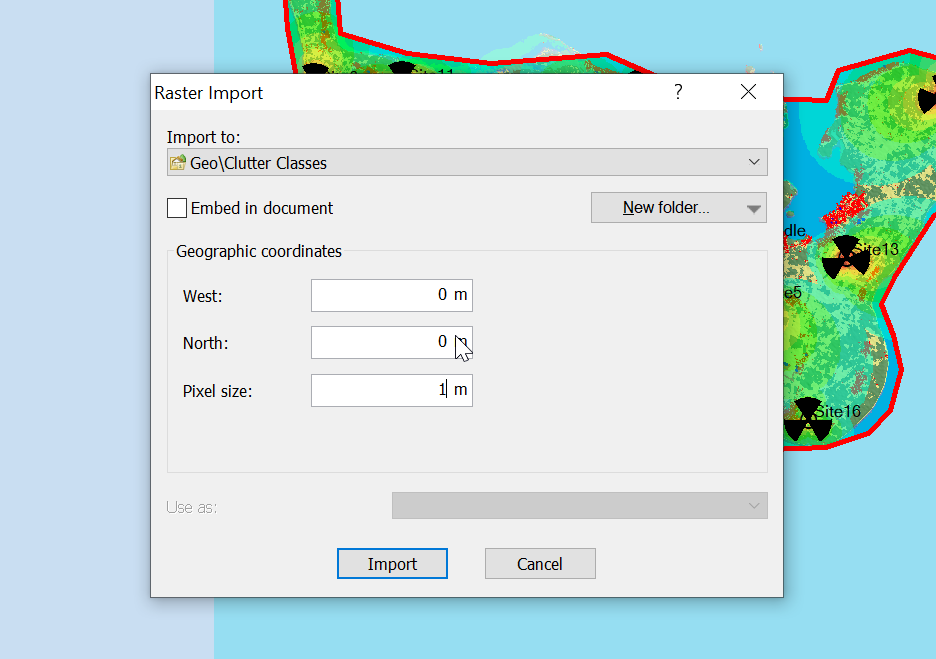
Now for the fancy part, we need to import it into Atoll.
When we import the data we import it as Raster data (Clutter Classes) with a pixel size of 1m.
Alas when we exported the data we’ve lost the positioning information, so while we’ve got the clutter data, it’s just there somewhere on the planet, which with the planet being the size it is, is probably not where you need it.
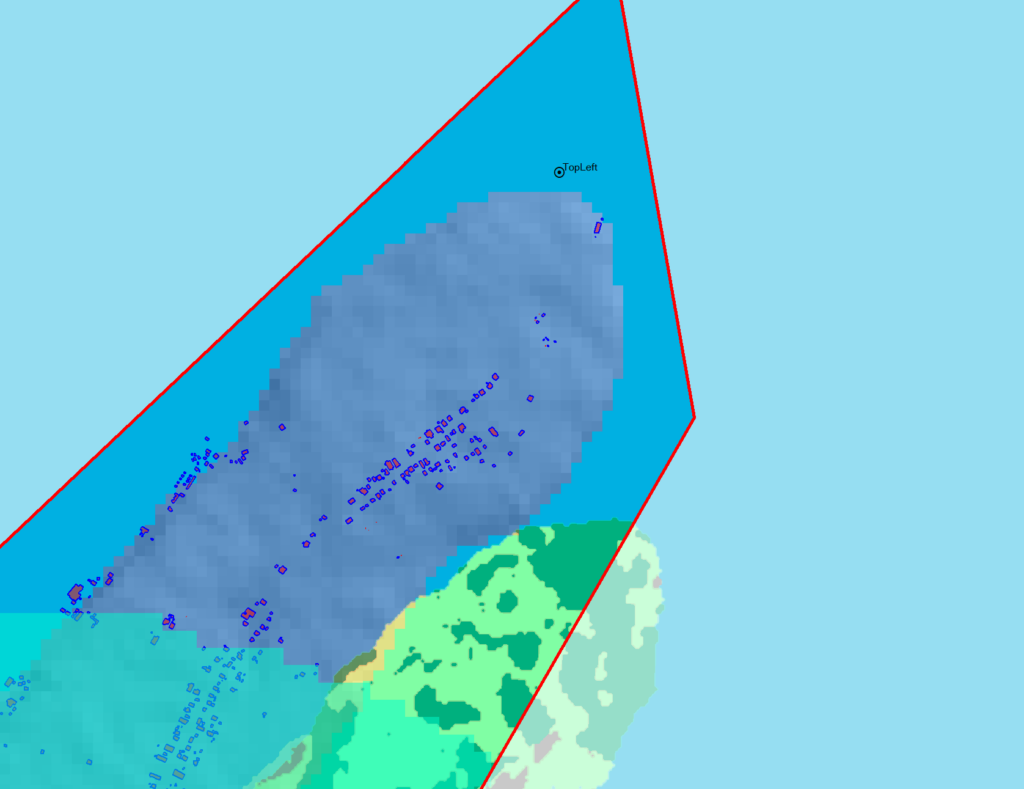
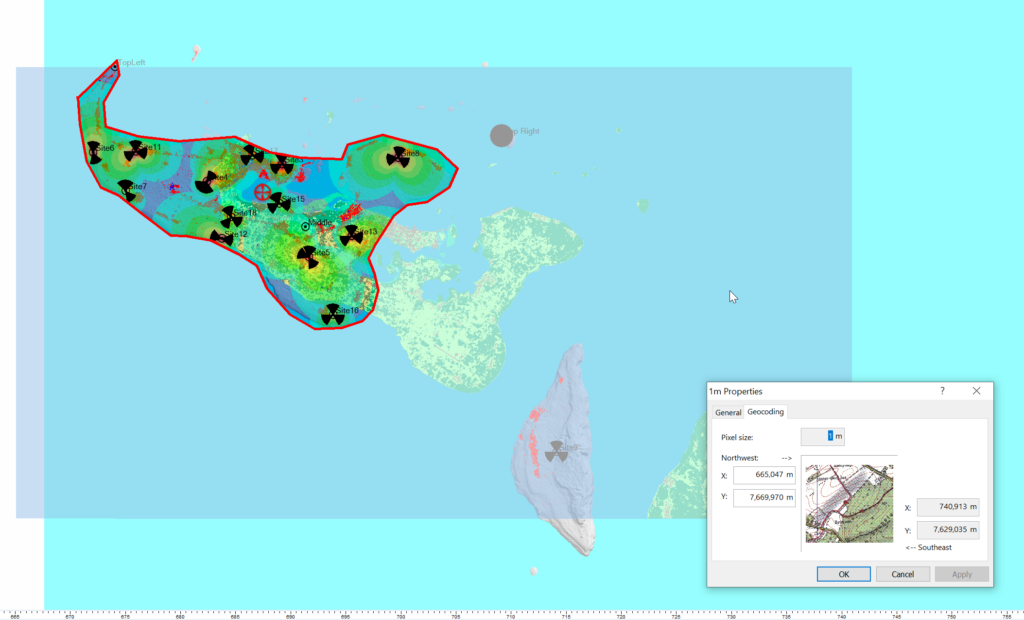
So I cheat, I start put putting the West and North values to match the values from a Cell Site I’ve already got on the map (I put one in the top left and bottom right corners of the map) and use that as the initial value.
Then – and stick with me, this is very technical – I mess with the values until the maps line up into the correct position. Increase X, decrease Y, dialing it it in until the clutter map lines up with the other maps I’ve got.
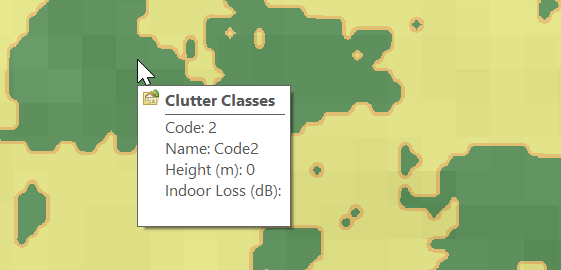
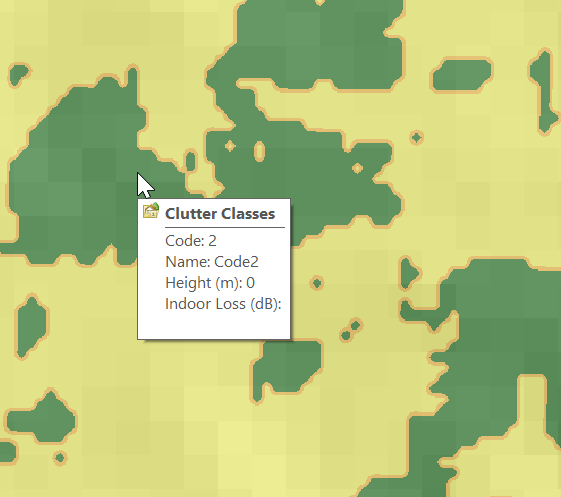
Right, now we’ve got the data but we don’t have any values.
Each color represents a clutter class, but we haven’t set any actual height or losses for that material.
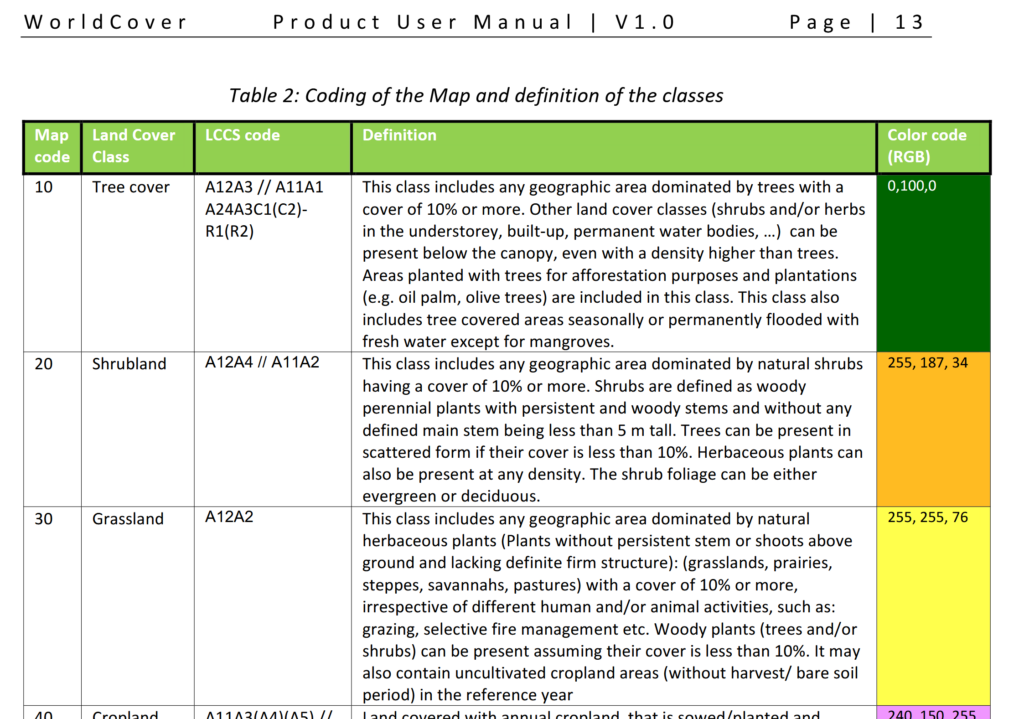
Alas the Map Code does not match with the table in the manual, but the colours do, here’s what mine map to:
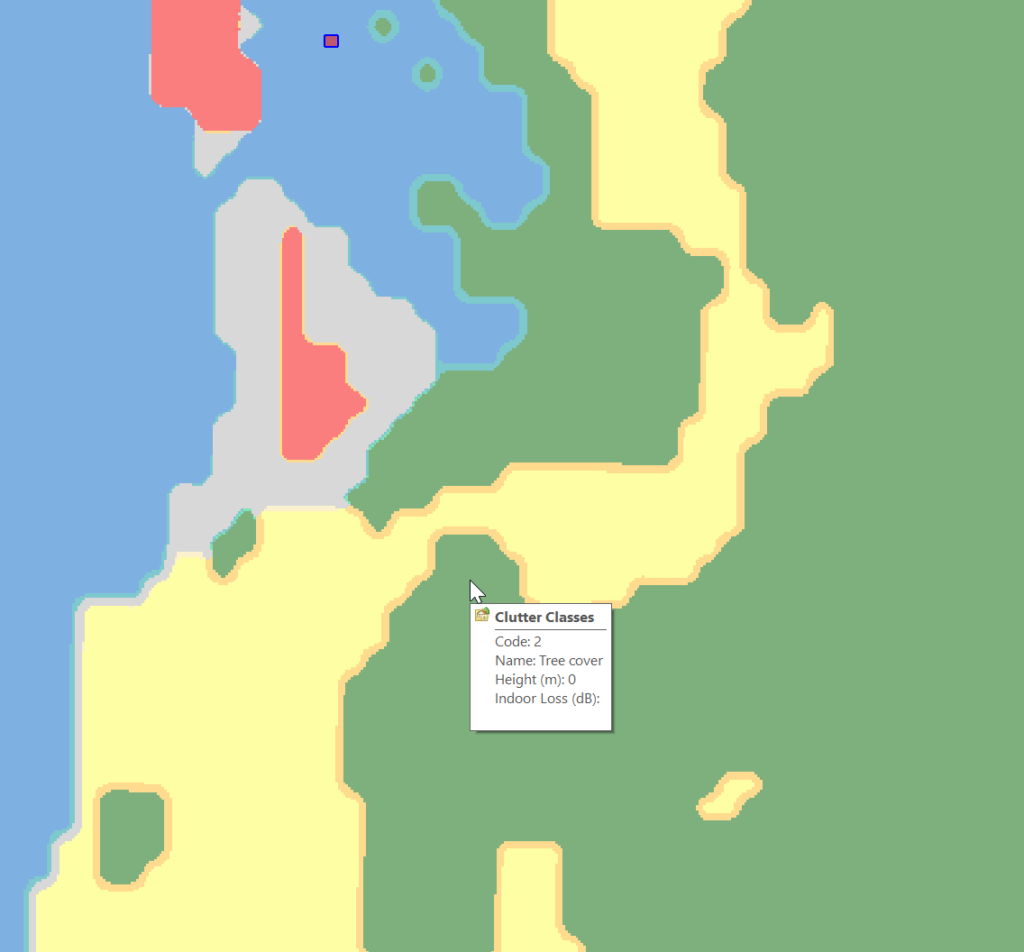
Which means when hovering over a layer of clutter I can see the type:
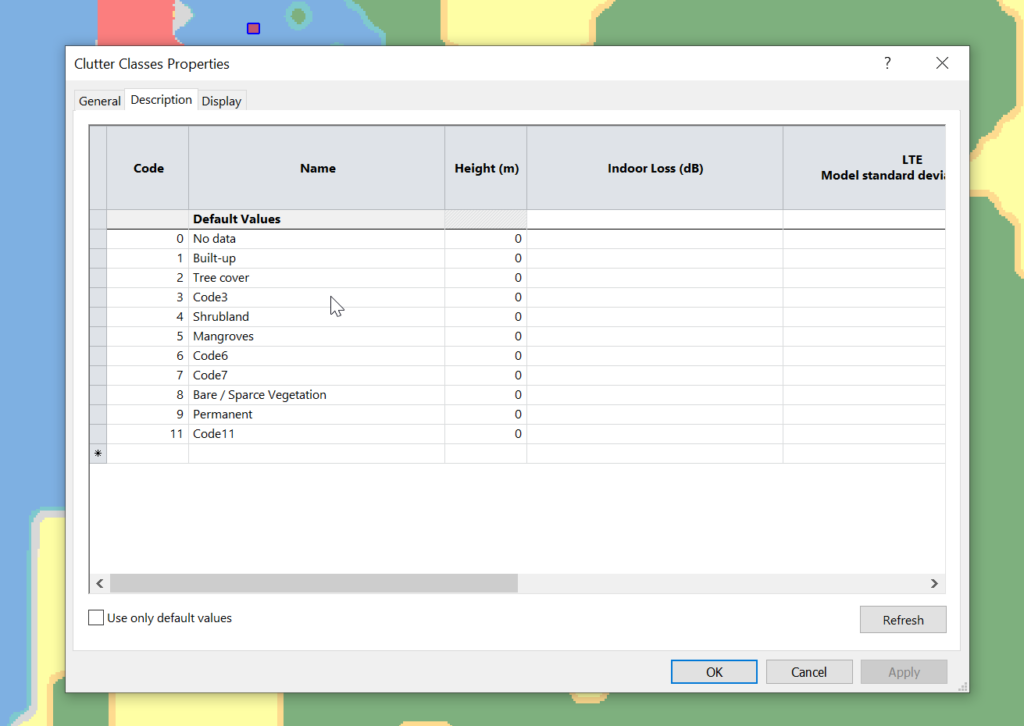
Next we need to populate the heights, indoor and outdoor losses for that given clutter. This is a little more tricky as it’s going to vary geography to geography, but there’s indicative loss numbers available online pretty easily.
Once you’ve got that plugged in you can run your predictions and off you go!
One of the really neat features about using automated RF planning tools like Forsk Atoll is you’re able to get it to automatically try out tweaks and look at how that impacts performance.
In the past you’d adjust something, run the simulation again, look at the results and compare to what you had before,
Atoll’s ACP (Automatic Cell Planning) module allows you to automate this, and in most cases, it does a better job than I would!
Today we’ll look at Cell Site Selection in Atoll.
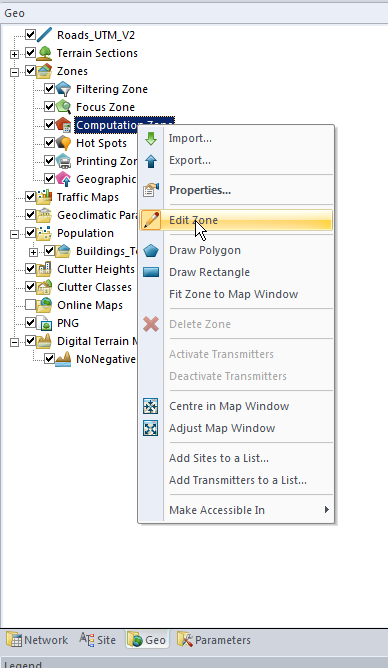
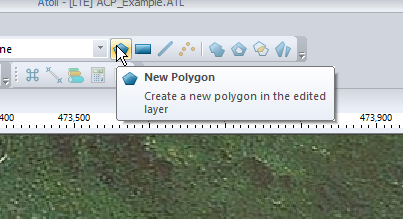
To begin with we’ll limit the computation area down to a polygon we draw around the area in question,
In the Geo tab we’ll select Zones -> Computation Zone and select Edit
We’ll create a new Polygon and draw around the area we are going to analyze. You can automate this step based on population levels, etc, if you’ve got that data present.
So now we’ve set our computation area to the selection, but if we didn’t do this, we’d be computing for the whole world, and that might take a while…
Generating Candidate Sites
Atoll sucks at this, I’ve found if your computation zone is set, and it’s not a rectangle, bad things happen, so I’ve written a little script to generate candidates for me.
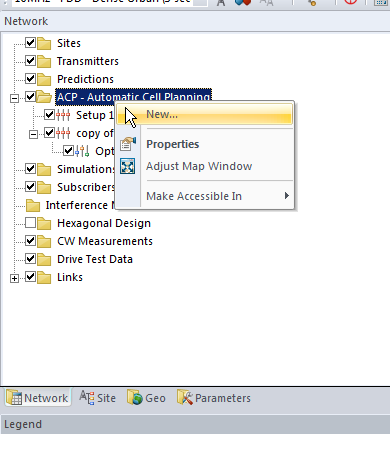
Creating an new ACP Job
From the Network tab, right click on ACP Automatic Cell Planning and select New
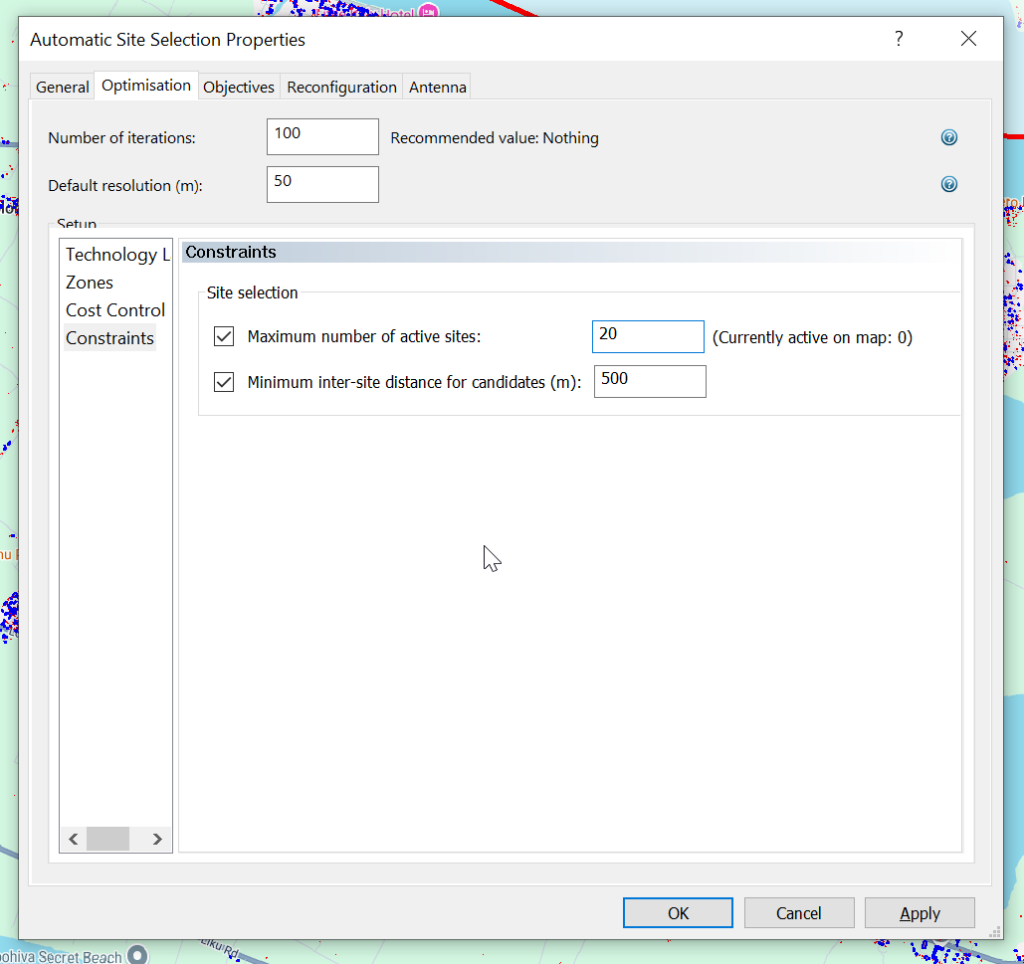
Optimization Tab
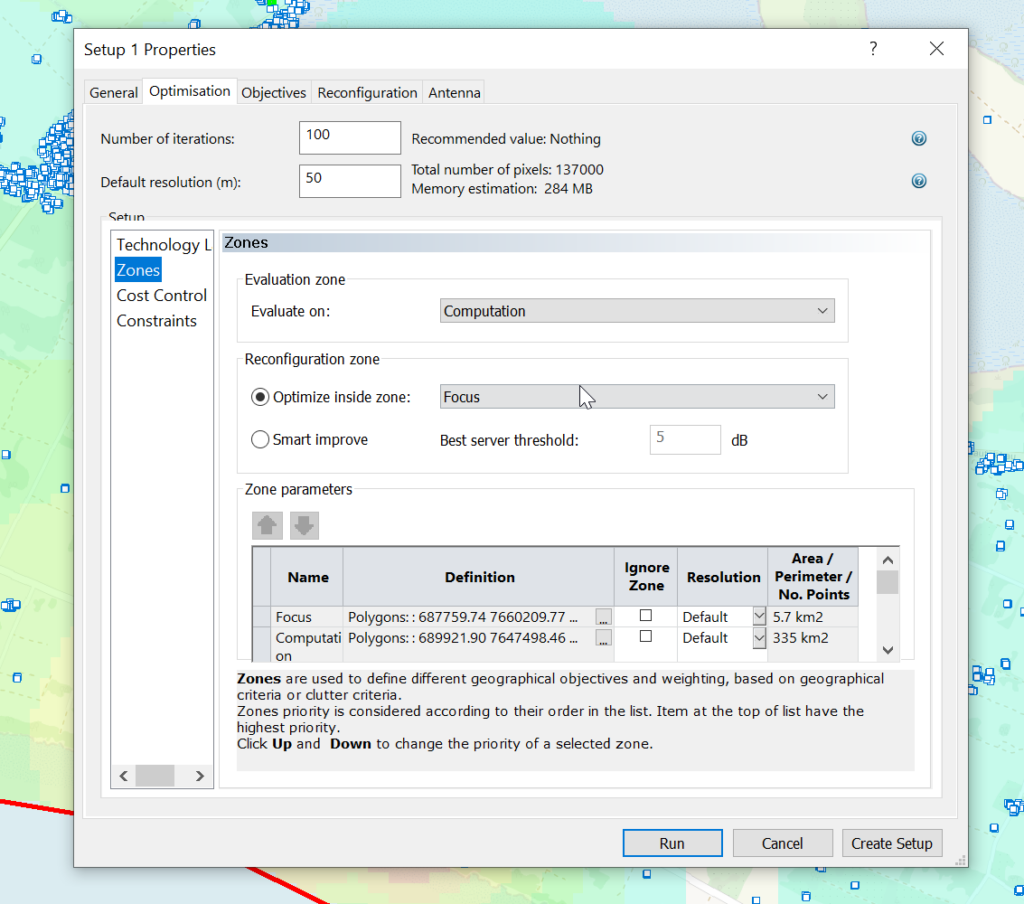
Before we can define all the specifics of what we’re looking to plan / improve, we need to set some limits on the software itself and tell it what we’re looking to improve.
The resolution defines how precise the results should be, and the iterations defines how many changes the software should run through.
The higher the number of iterations, the better the results, but it’s not linear – The improvement between 1000 iterations and 1,000,000,000 iterations is typically pretty minor, and this is because ACP works kind of a “getting warmer” philosophy, where it changes a value up or down, looks at the overall result and then if the result was better, changes the value again until it stops getting better.
As I’m working in a fairly small area I’m going to set 100 iterations and a 50m resolution.
In the optimization tab we can also set constraints, for example we’re looking at where to place cell sites in an area, and as far as Atoll is concerned if we just throw hundreds of sites at an area we’ll have pretty good results, but the economics of that doesn’t work, so we can set constraints, for example for site selection we may want to set the max number of cell sites. As we are importing ~5k candidate locations, we probably don’t want to build 5k cell sites 20m apart, so set this to be a reasonable number for your geography.
When using ACP for Optimization as we can see later on, we can also set cost constraints regarding the cost to make changes, but for now this is just going to pick best cell sites locations for us.
Objectives Tab
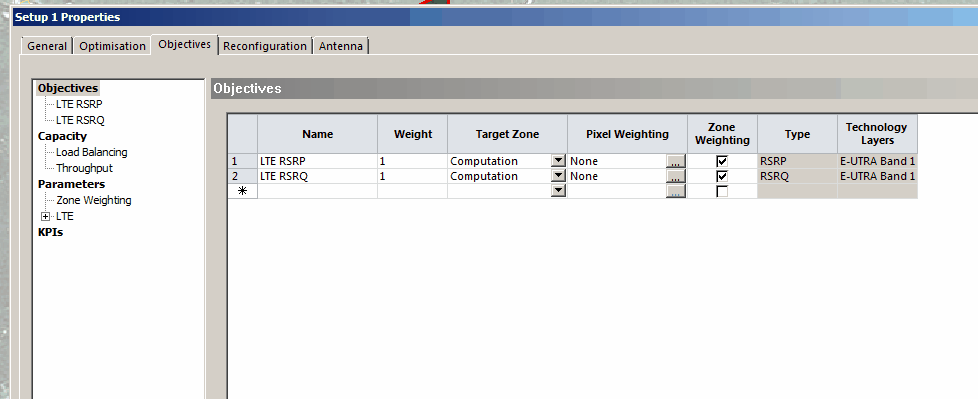
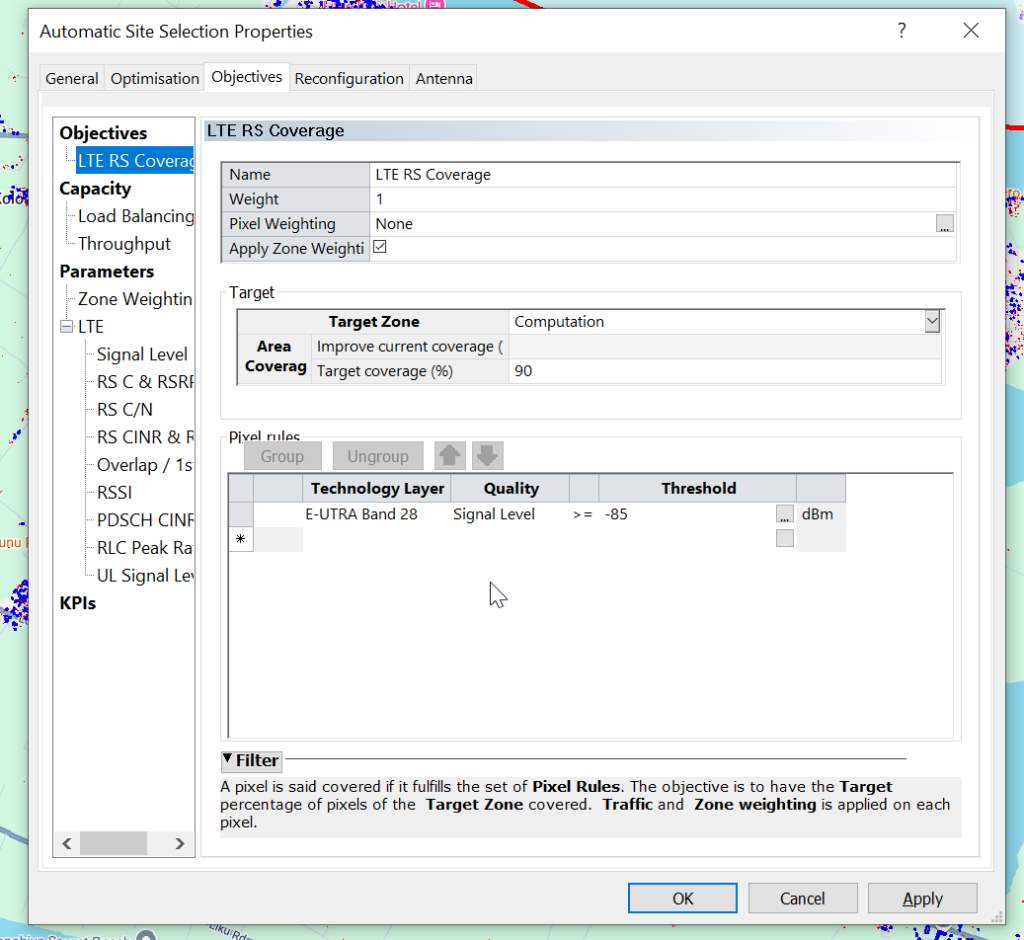
Next up we’ll need to setup Automatic Cell Plannings’ objectives.
For ACP to be an effective tool we need to define what we’re looking for in terms of success, you can’t just throw it some values and say “Make it better” – we need to define what parameters we’re looking to improve. We do this by setting Objectives.
Your objectives are going to be based on your needs and wants, but for this example we’re building greenfield networks, so want to offer coverage over an area, as well as good RSRP and RSRQ, so we will set the objectives to Coverage of 95% of the Computation Zone for this post, with a secondary objective of increasing RSRP and RSRQ.
But today I’m modeling for coverage, so let’s set that:
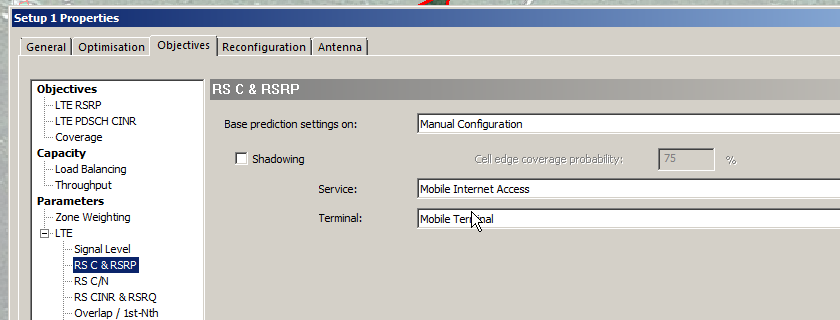
As we’re planning for LTE we need to set the UE parameters, as I’m planning for a mobile network, I’ll need to set the service type and terminal.
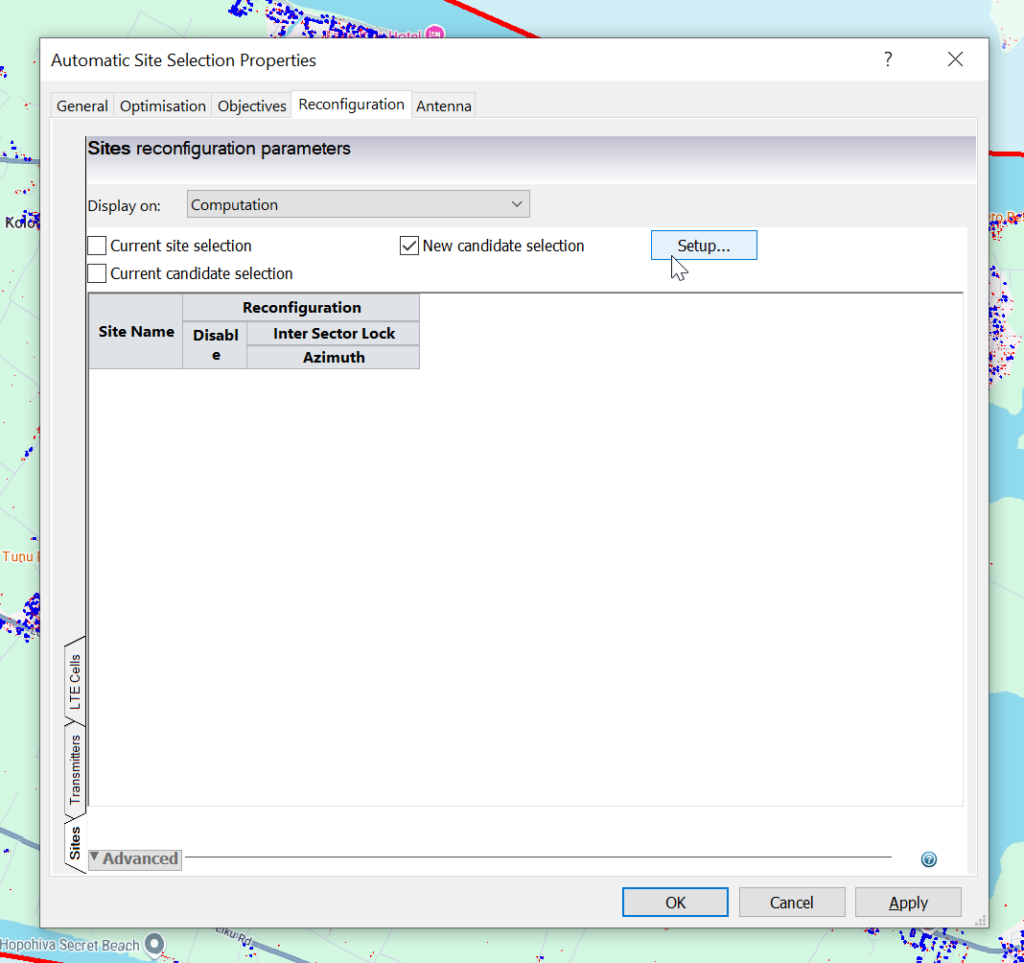
Reconfiguration
Now we’ve defined the Objectives, it’s now time to define what values ACP can mess with to try and achieve these objectives, for some ACP runs you may be adjusting tilts or azimuths, swapping out antennas, etc, but today we’re looking for where we can put cell sites to be the most effective to serve our target area.
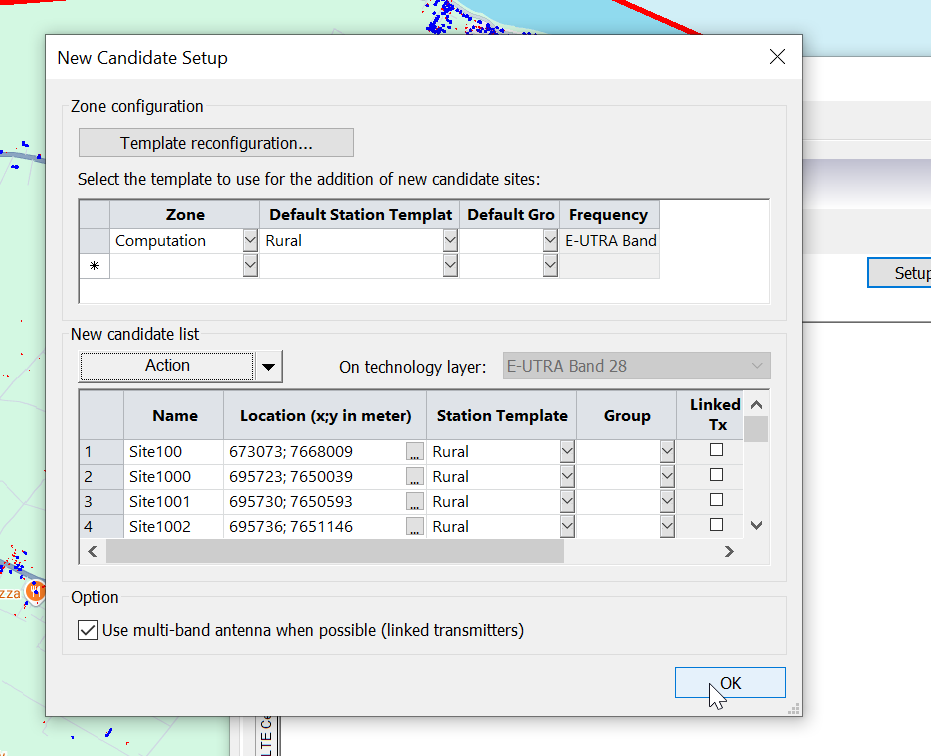
Now we import our candidate list. This might be a list of potential towers you can use, or in my case, for something greenfield, I’m just importing a list of points on a map every X meters to find the best locations to place towers.
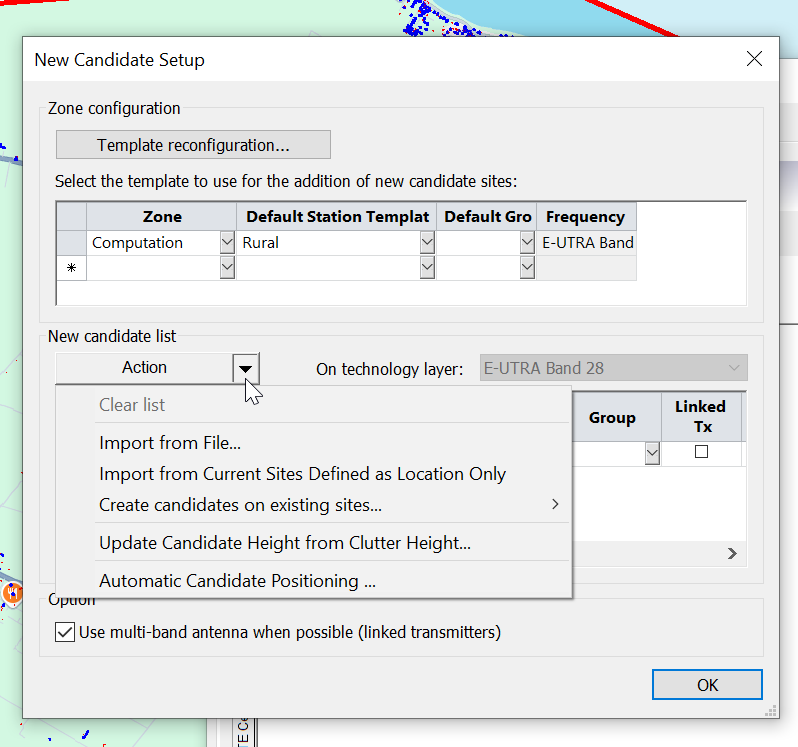
From the “Reconfiguration”, we’ll select “Setup” to add the sites we want to evalute.
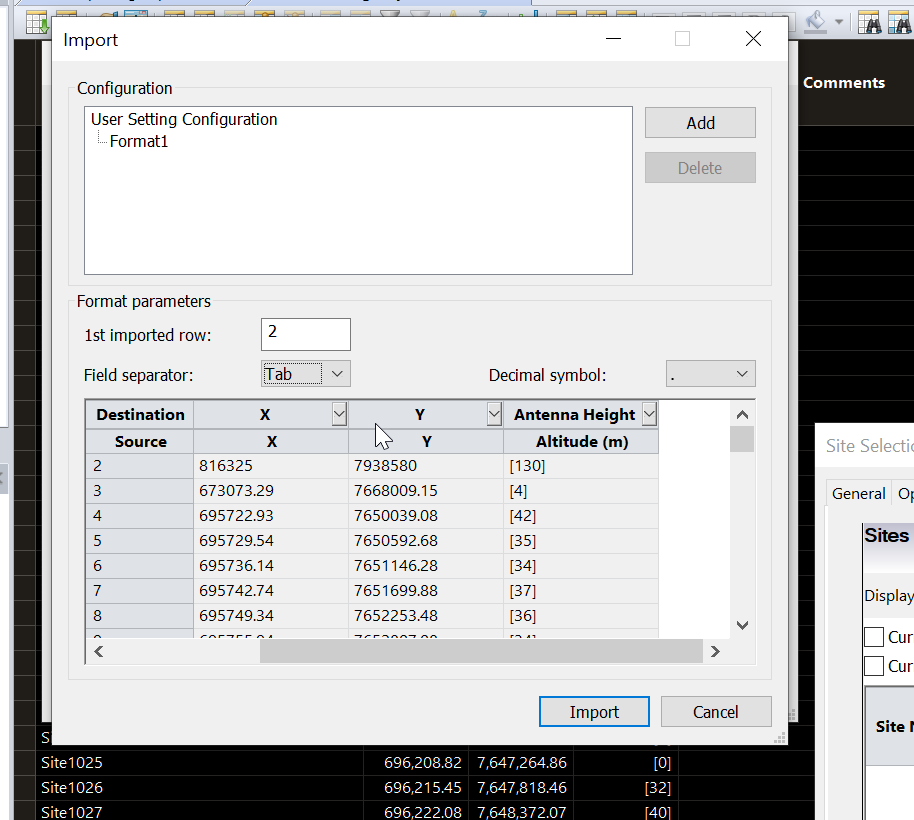
Atoll has “Automatic Candidate Positioning” which allows it to generate pins on the map, but I’ve not had any luck with it, instead I’m importing a list of candidates I’ve generated via a little Python script, so I’ll select “Import from File”.
Pick my file and set the parameters for importing the data like so.
Now we’ve got candidates for cell sites defined, we set the station template to populate and then we’re good to go.
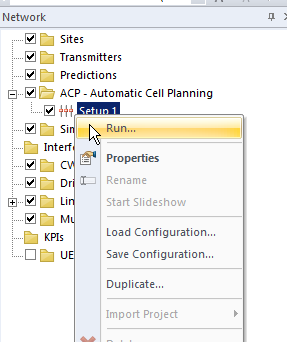
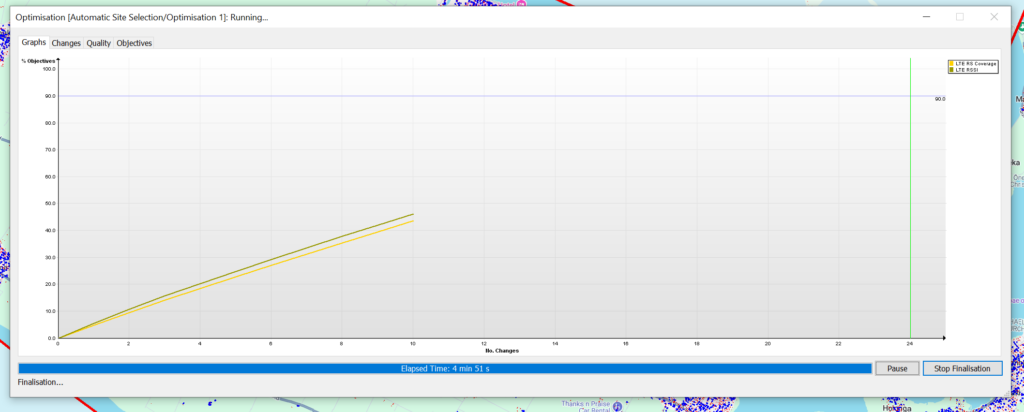
Running ACP
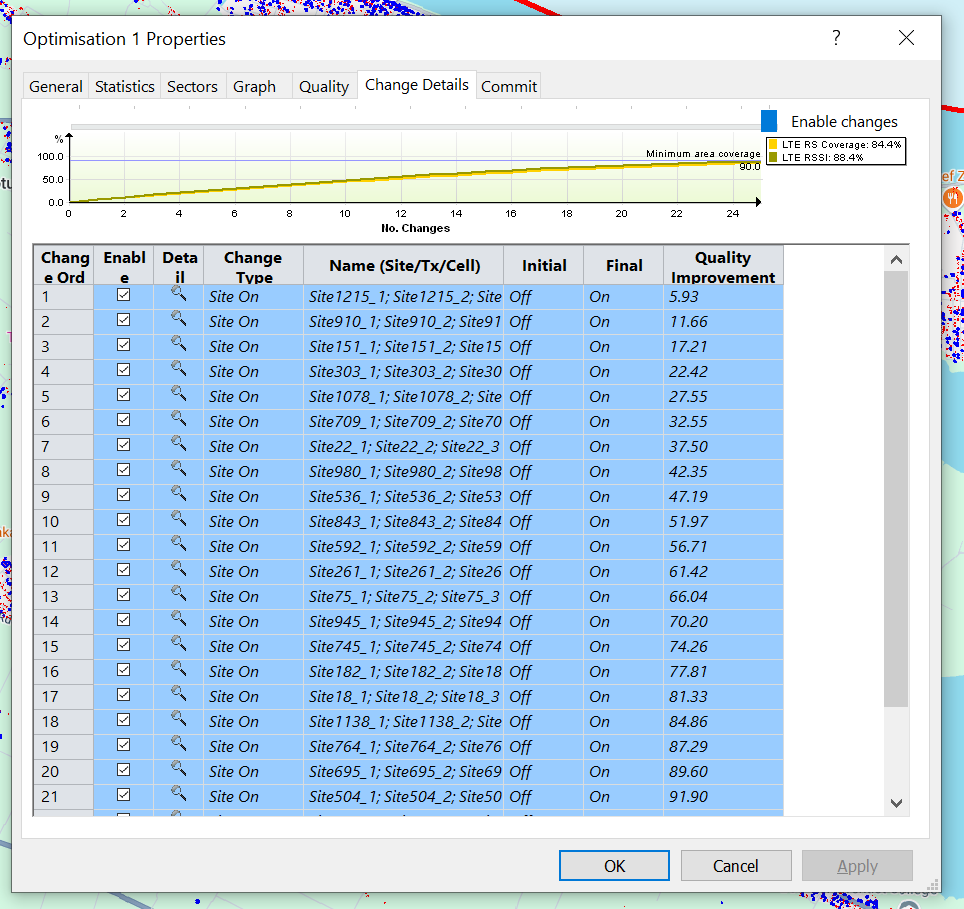
Once you’ve tweaked all your ACP values as required, we can run the ACP job,
As ACP runs you’ll see a graph showing the objectives and the levels it needs to reach to satisfy them, this step can take a super dooper long time – Especially if your computation zone is large or your number of candidates is large.
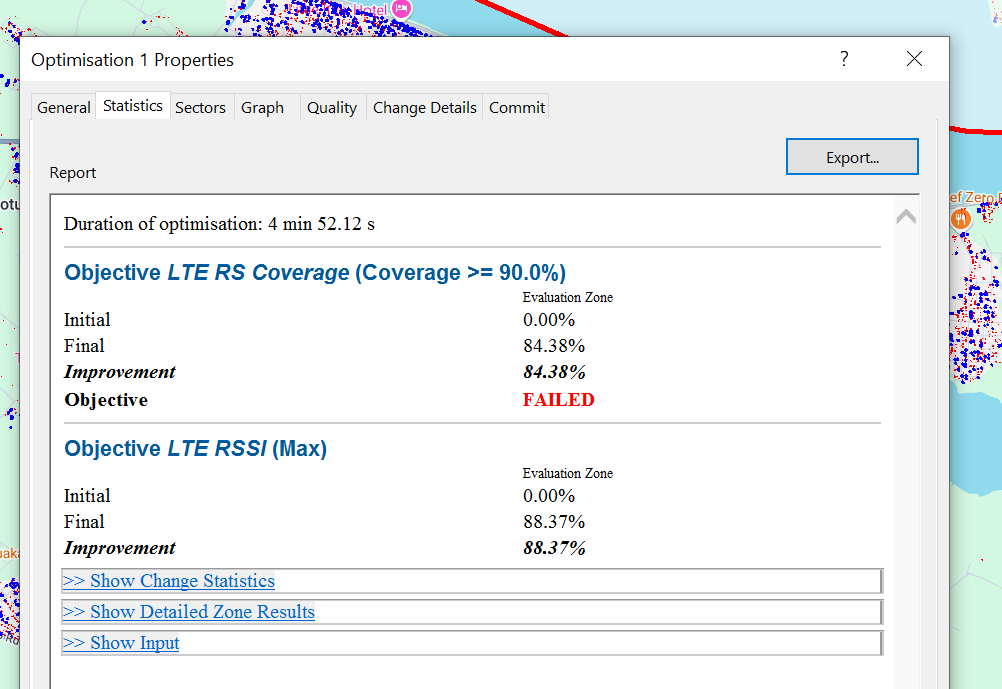
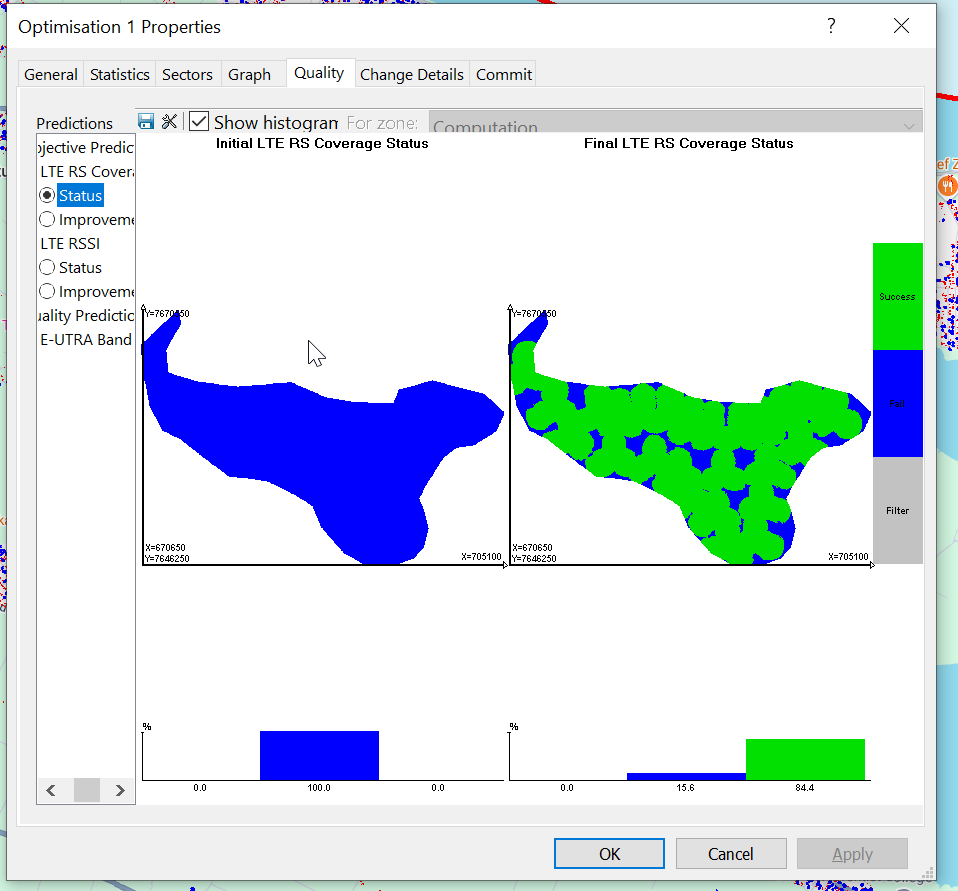
But eventually we’ll be a lot older and wearier, but ACP will have completed, and we can checkout the Optimization it’s created.
In my case the objectives failed to be met, but that’s OK for me,
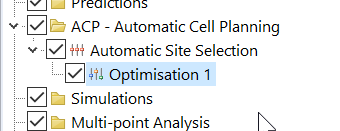
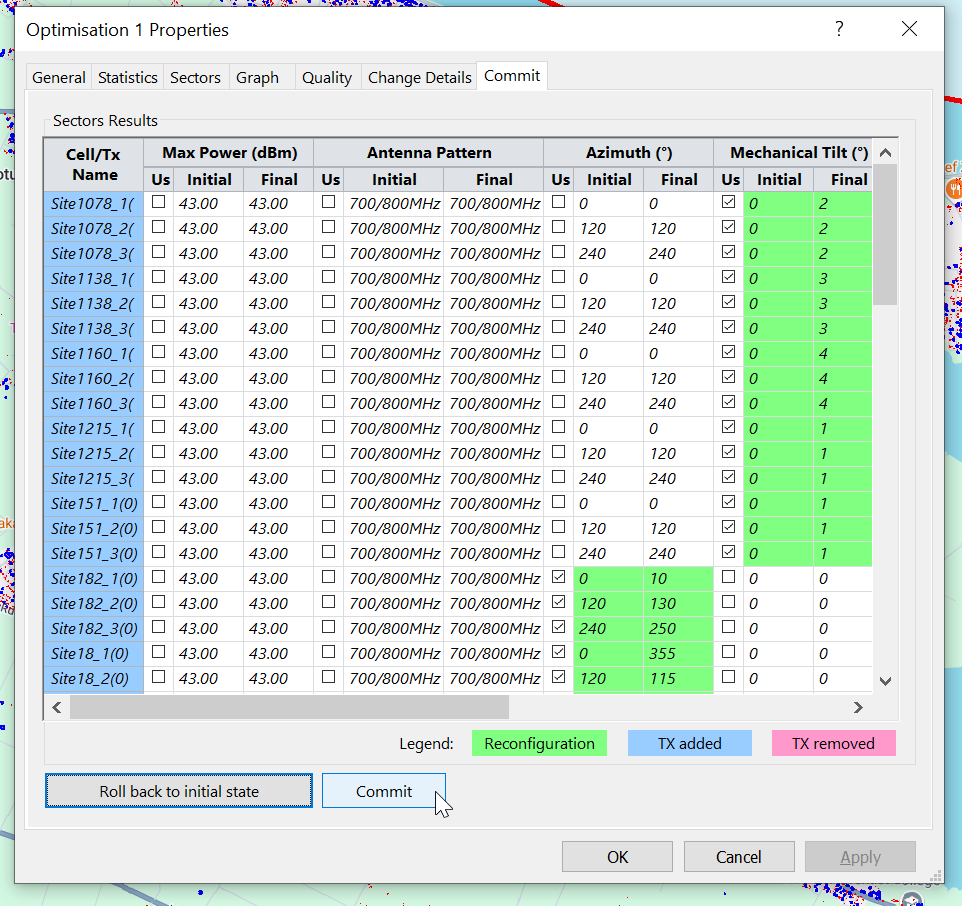
One it’s completed the Changes tab outlines the recommended changes, and the Objectives outlines how this has performed against the criteria we outlined at the start, and if we’re happy with the result, we can Commit the changes to put them on the map from the commit tab.
With that done I weed out the sites in impractical locations, the the ones in the sea…
Now we’ve got the sites plugged in, the next thing we’ll start doing is optimizing them.
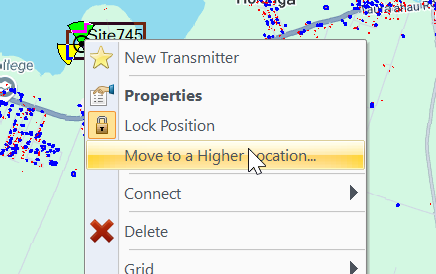
When we’re dealing with greenfield builds like we are today, the “Move to highest location with X Meters” function is super useful. If you’ve got a high point on a property, we want to build our tower on the highest point, so the tower is moved to the highest point.
One thing to note is this just plans our grid. It won’t adjust azimuths, downtilts, etc, in one operation. We need to use another ACP operation to achieve that, and that’s the content of a different post!
You’ve done the flatland model we did Part 1 and now you’re pumped up and ready to start plotting your cell sites, optimizing your coverage and boosting the services you’re offering.
But one thing stands in your way – The predicted & modeled data we get out of Atoll is only going to be as good as the data we’ve given it, the old garbage in garbage out adage.
So let’s get started, we’ll create a new document from Template again and select LTE.
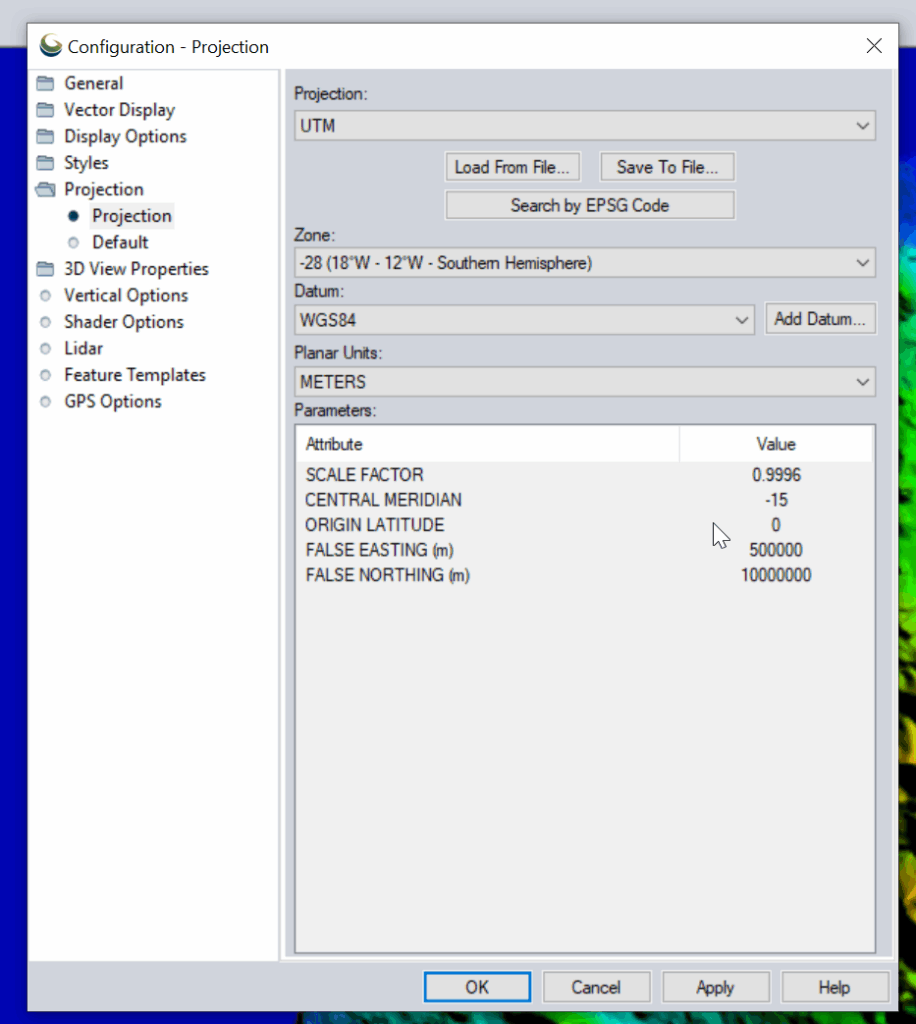
Setting our Projection
Now before we go throwing out cell sites we’re going to have to tell Atoll where we are, this can get a little tricky if you’re setting this up for a different real world location, but stick with me and I’ll give you the data you need for this example.
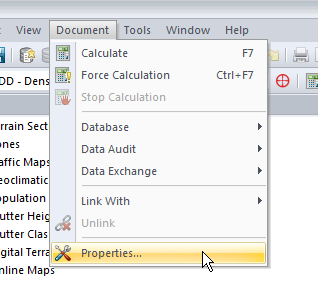
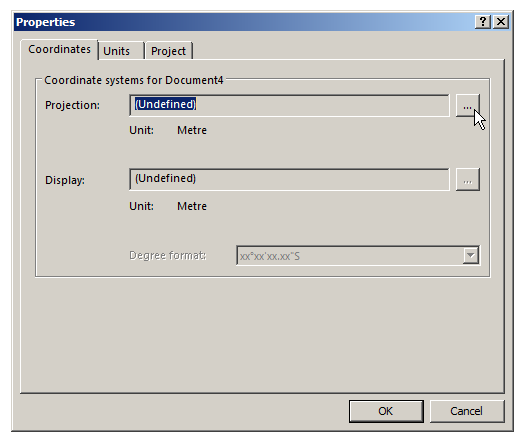
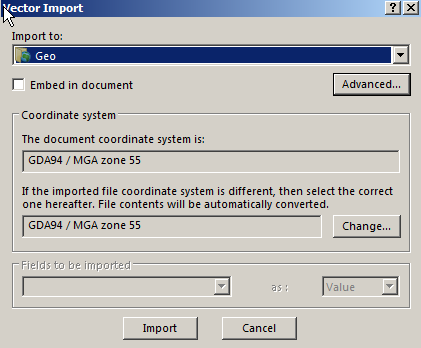
We’ll select Document -> Properties and we’ve got to define a projection,
A projection is essentially a coordinate system, like Latitude and Longitude, that constrains our project to somewhere on this planet.
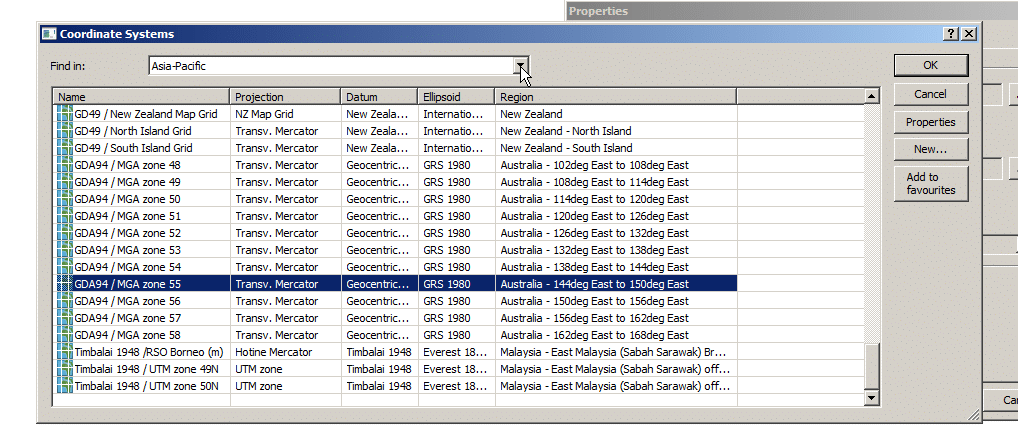
In this example we’re in Australia, so we’ll select Asia Pacific from the “Find In” section and scroll until we find MGA Zone 55. We’ll select it and click OK.
All this Zone information makes sense to GIS folks, there’s lots of information online about UTM datums, projections and GIS, which can help you select the right Coordinate system and projection for your particular area – But for us we’ll select MGA Zone 55 and that’s the last we’ll hear about it.
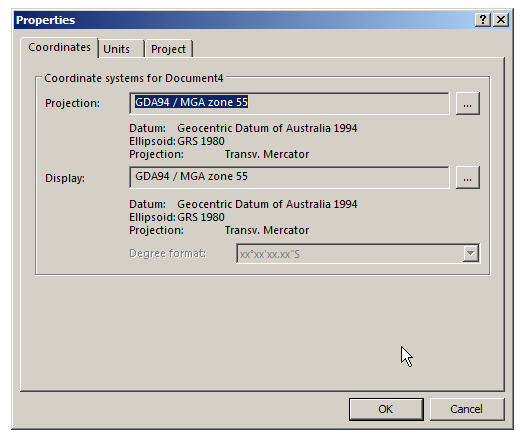
So now we’ve got that information setup we’ll hit Ok again and be on our way. Atoll now knows where in the world we are and we can start filling in the specifics.
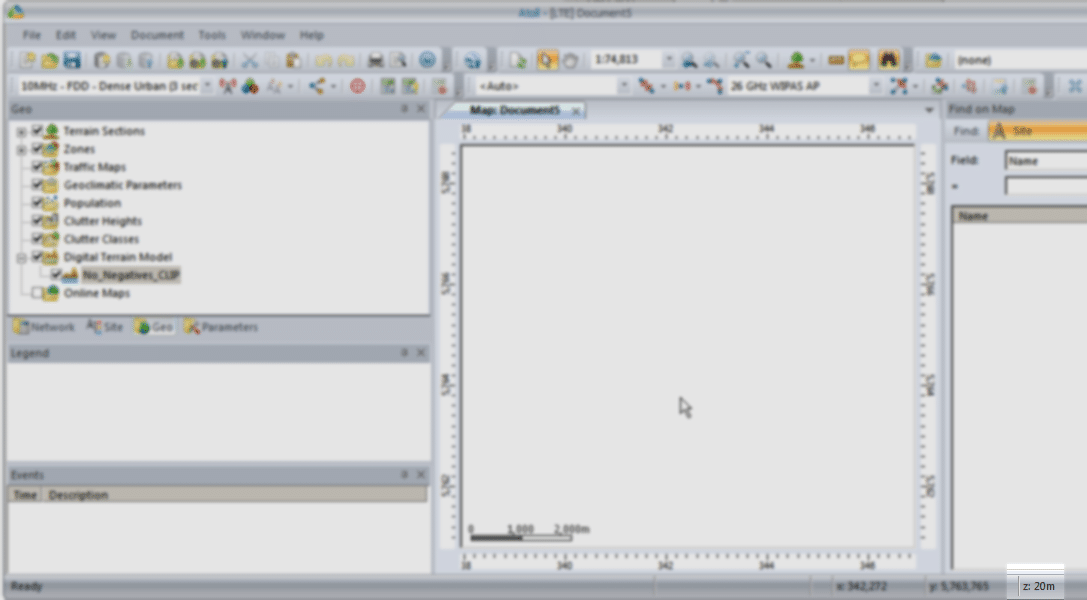
So now we’ve still got an empty map with nothing to show, so let’s add some data.
Adding Population and Roads
We’ll start by adding some base data, we’ll import a footprint of the Island and a map of all the roads.
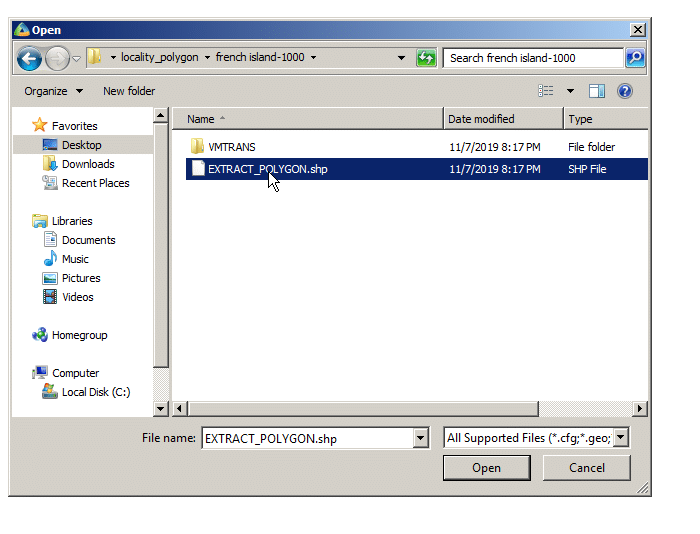
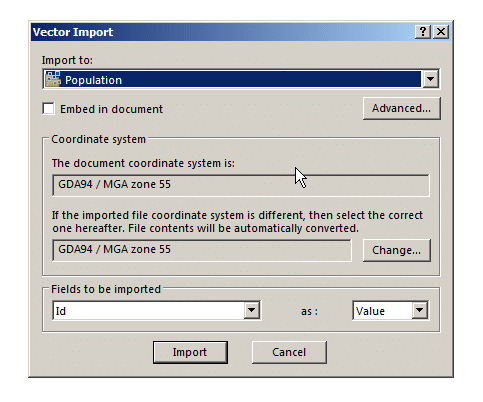
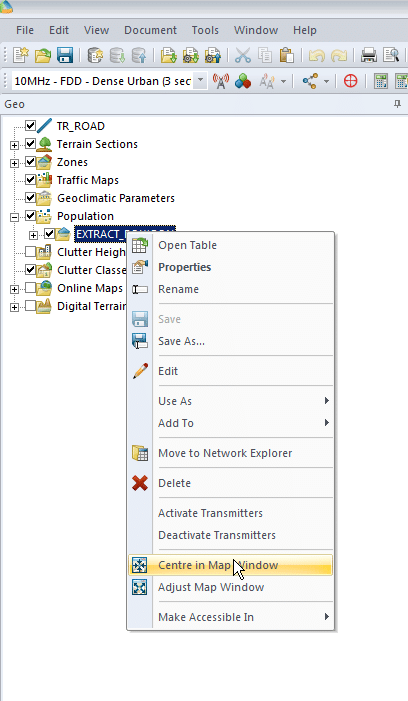
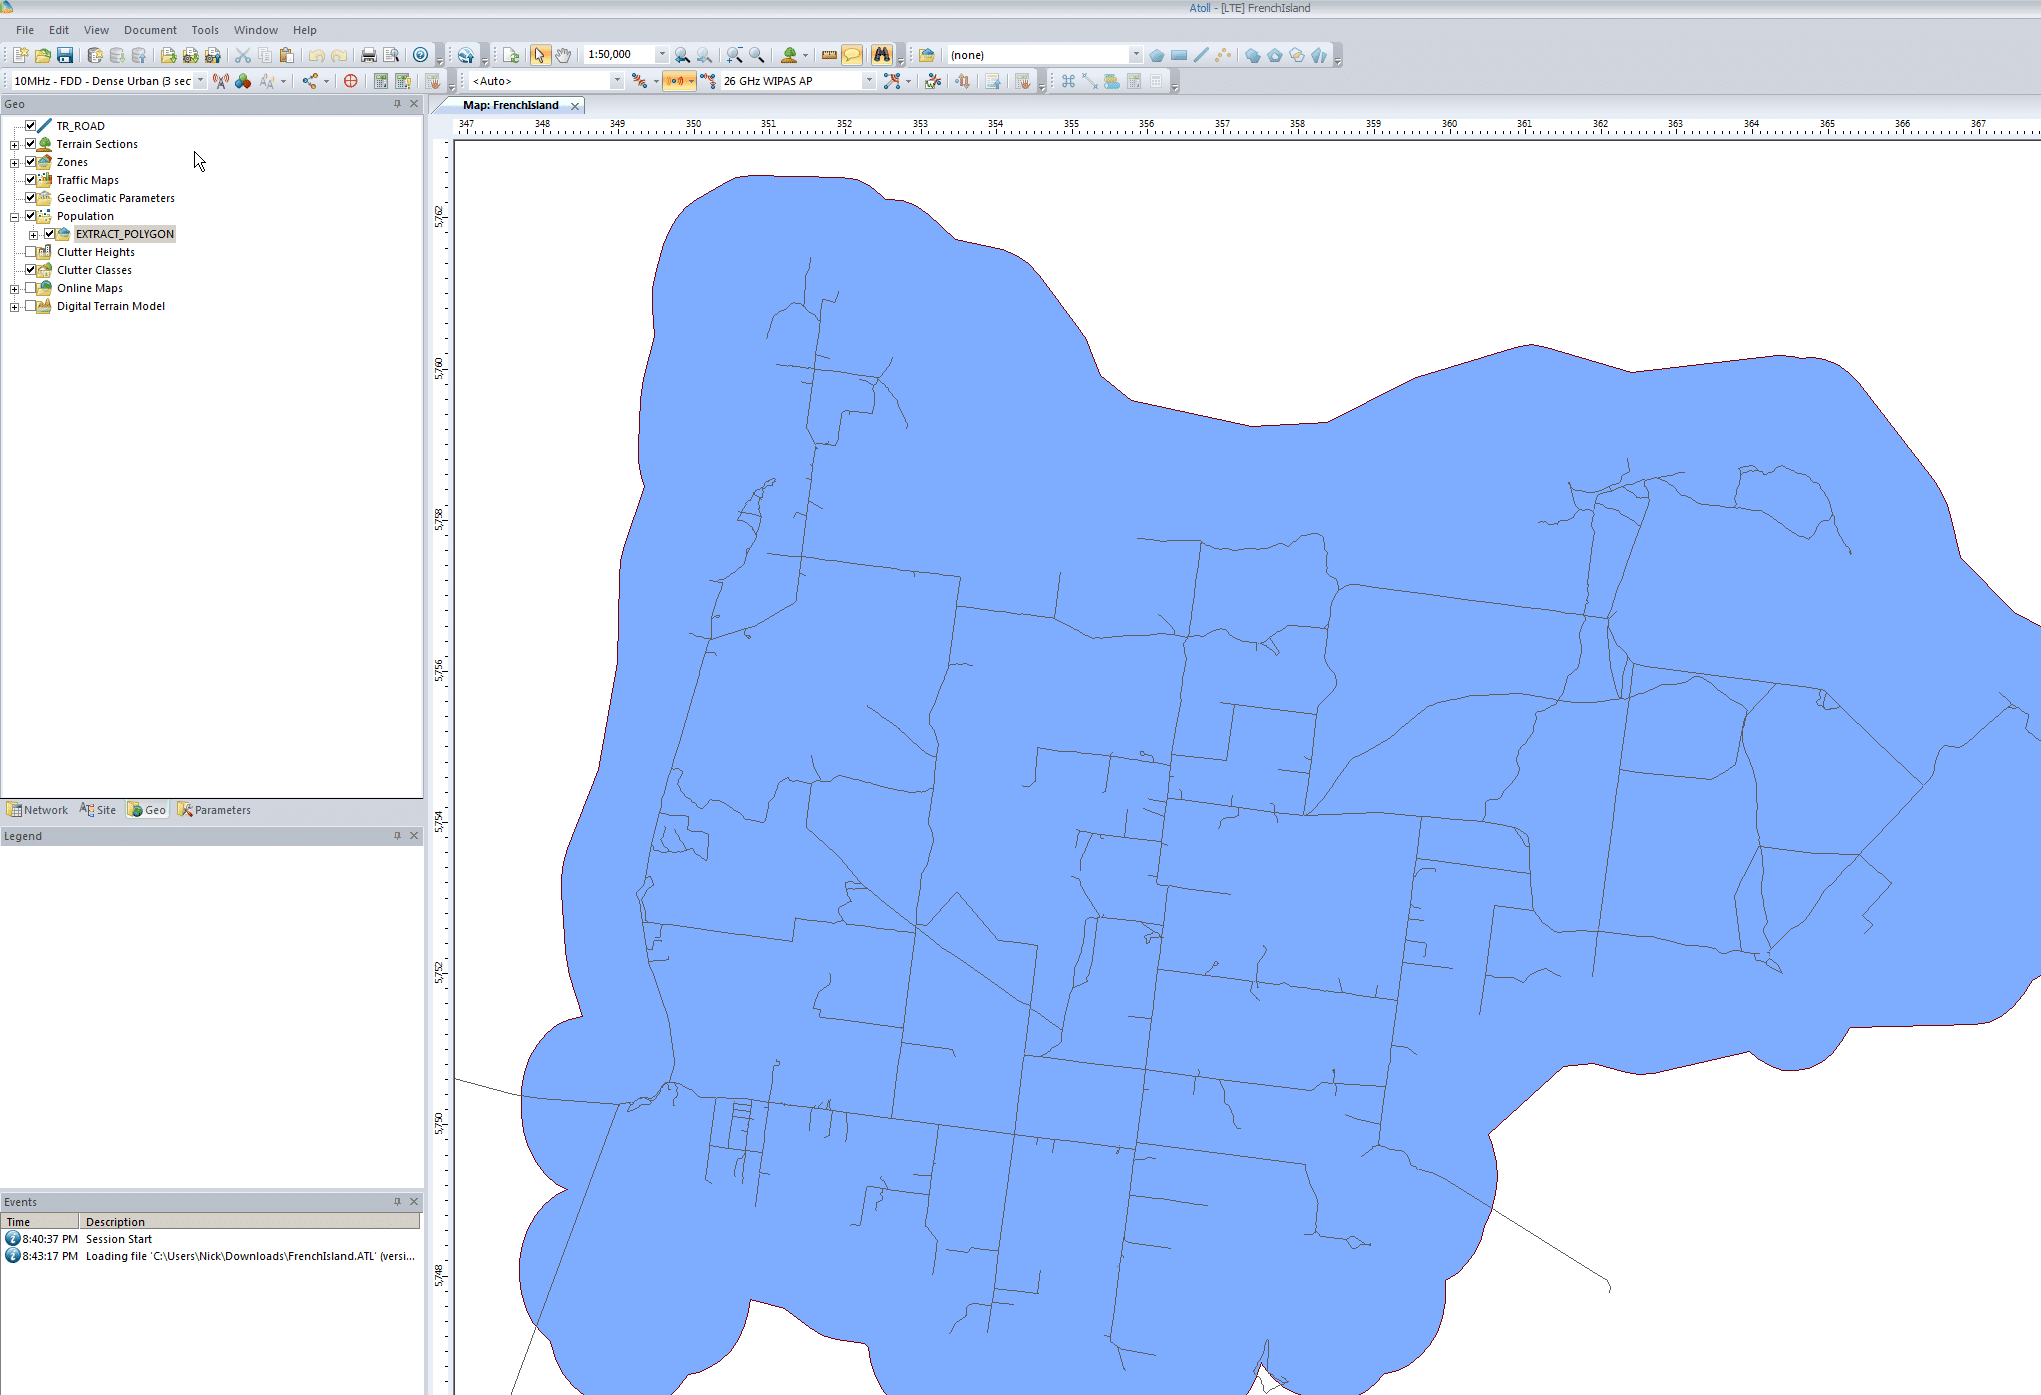
First we’ll import the populated area outline it into Atoll from File -> Import and select the file called EXTRACT_POLYGON.shp
We’ll put it into the population folder, this will be useful later when we try and ensure this area is covered by our network.
Although the population data is kind of rough ( <100 for the entire area) it’s still very useful for limiting our coverage area and saying “We’ve got everyone covered” when it comes to coverage.
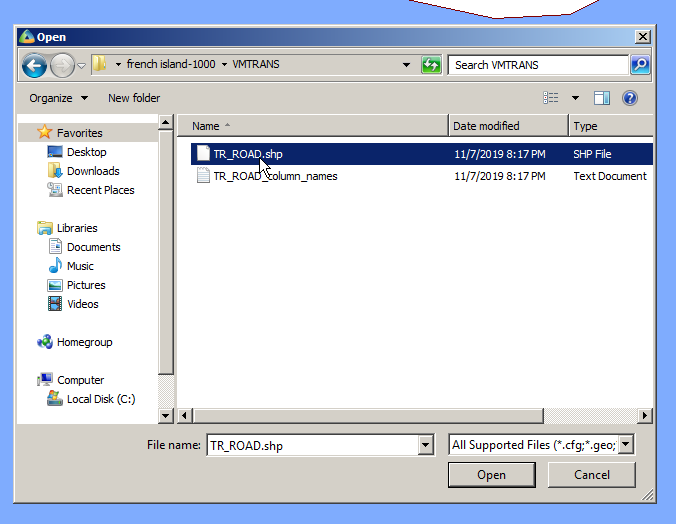
Next up we’ll import the roads file, same thing, File -> Import, TR_ROAD.shp
We’ll import it to the Geo folder – This is just data that Atoll doesn’t process but is useful to us as humans.
Finally we’ll enable the layers we’ve just imported and center the map on our imported data to get us in the right region. We’ll do this by expanding “Population”, right clicking on the file we just imported and selecting “Center in Map Window”
You may have to tick the layer to enable itPopulation footprint with roads
Adding Elevation Data
Again, like our Datum elevation data is a standard GIS concept, but if you’re from an RF background you’ve probably not come across it, essentially it’s an image where the shade of each pixel translates to a height above sea level.
We import it into Atoll and it’s used in propagation modeling – after all we need to know if there’s a hill / mountain / valley in the way, and even slight rises / dips in the geography can have an impact on your coverage.
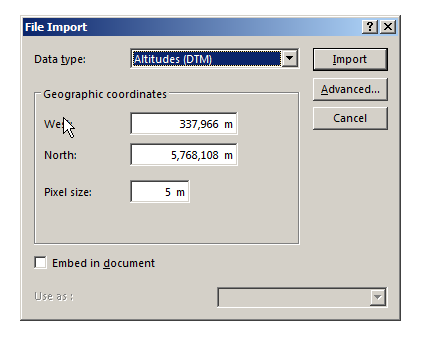
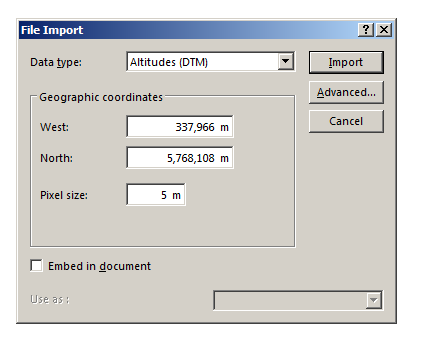
We’ll start by downloading the file above, and then importing it into Atoll
Next we’ll need to tell Atoll the type of data we’re importing (Altitudes) and it’s offset from the 0 point of our coordinate system, I’ve put the information we need for this into a handy table below:
West
337,966
North
5,768,108
Pixel Size
5m
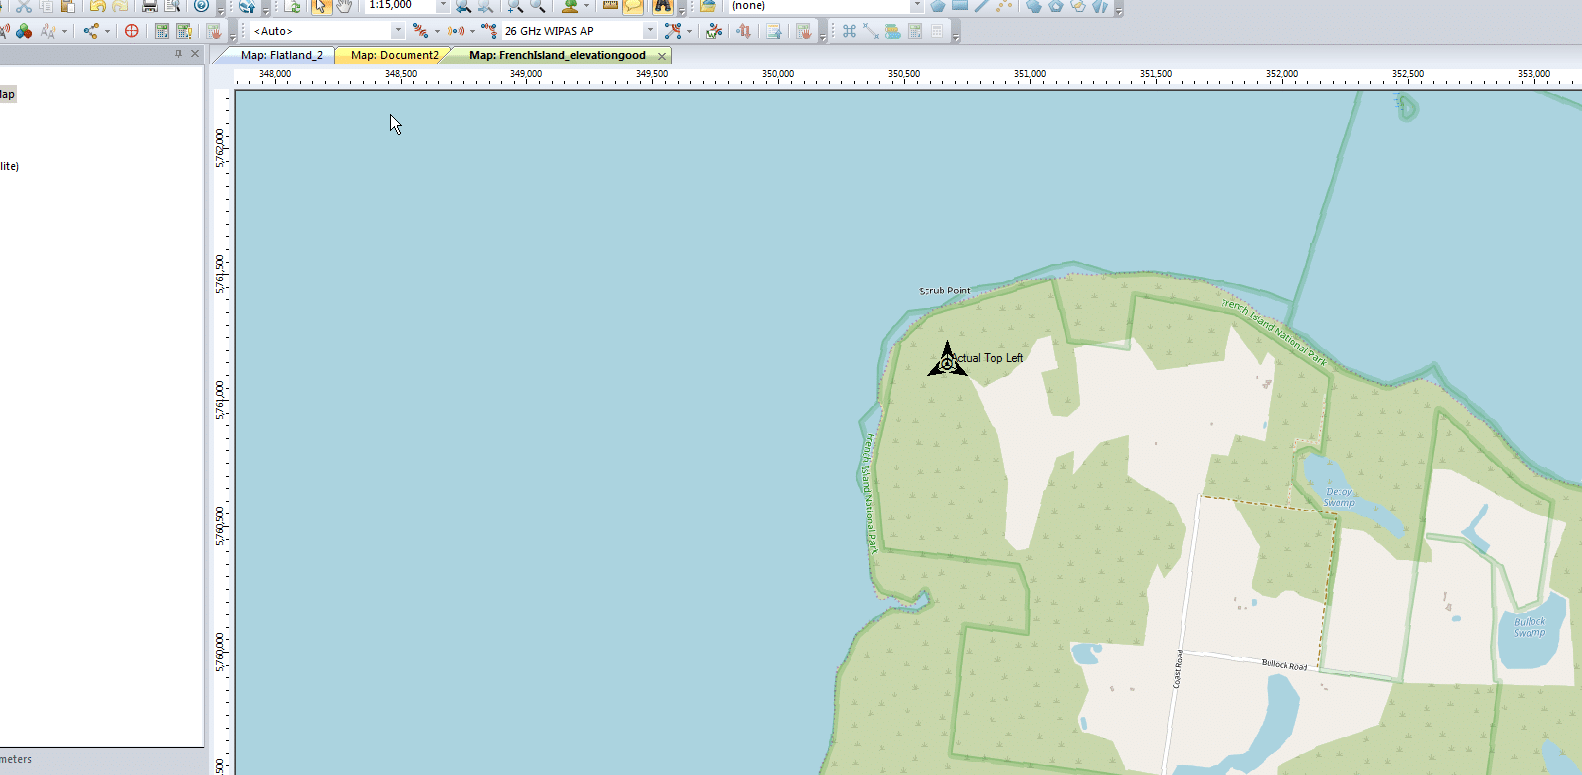
Now when we move our cursor around we’ll see the elevation change in the bottom right ( z is height).
This is because the elevation data is kind of invisible (We’re looking top down) but it’s there.
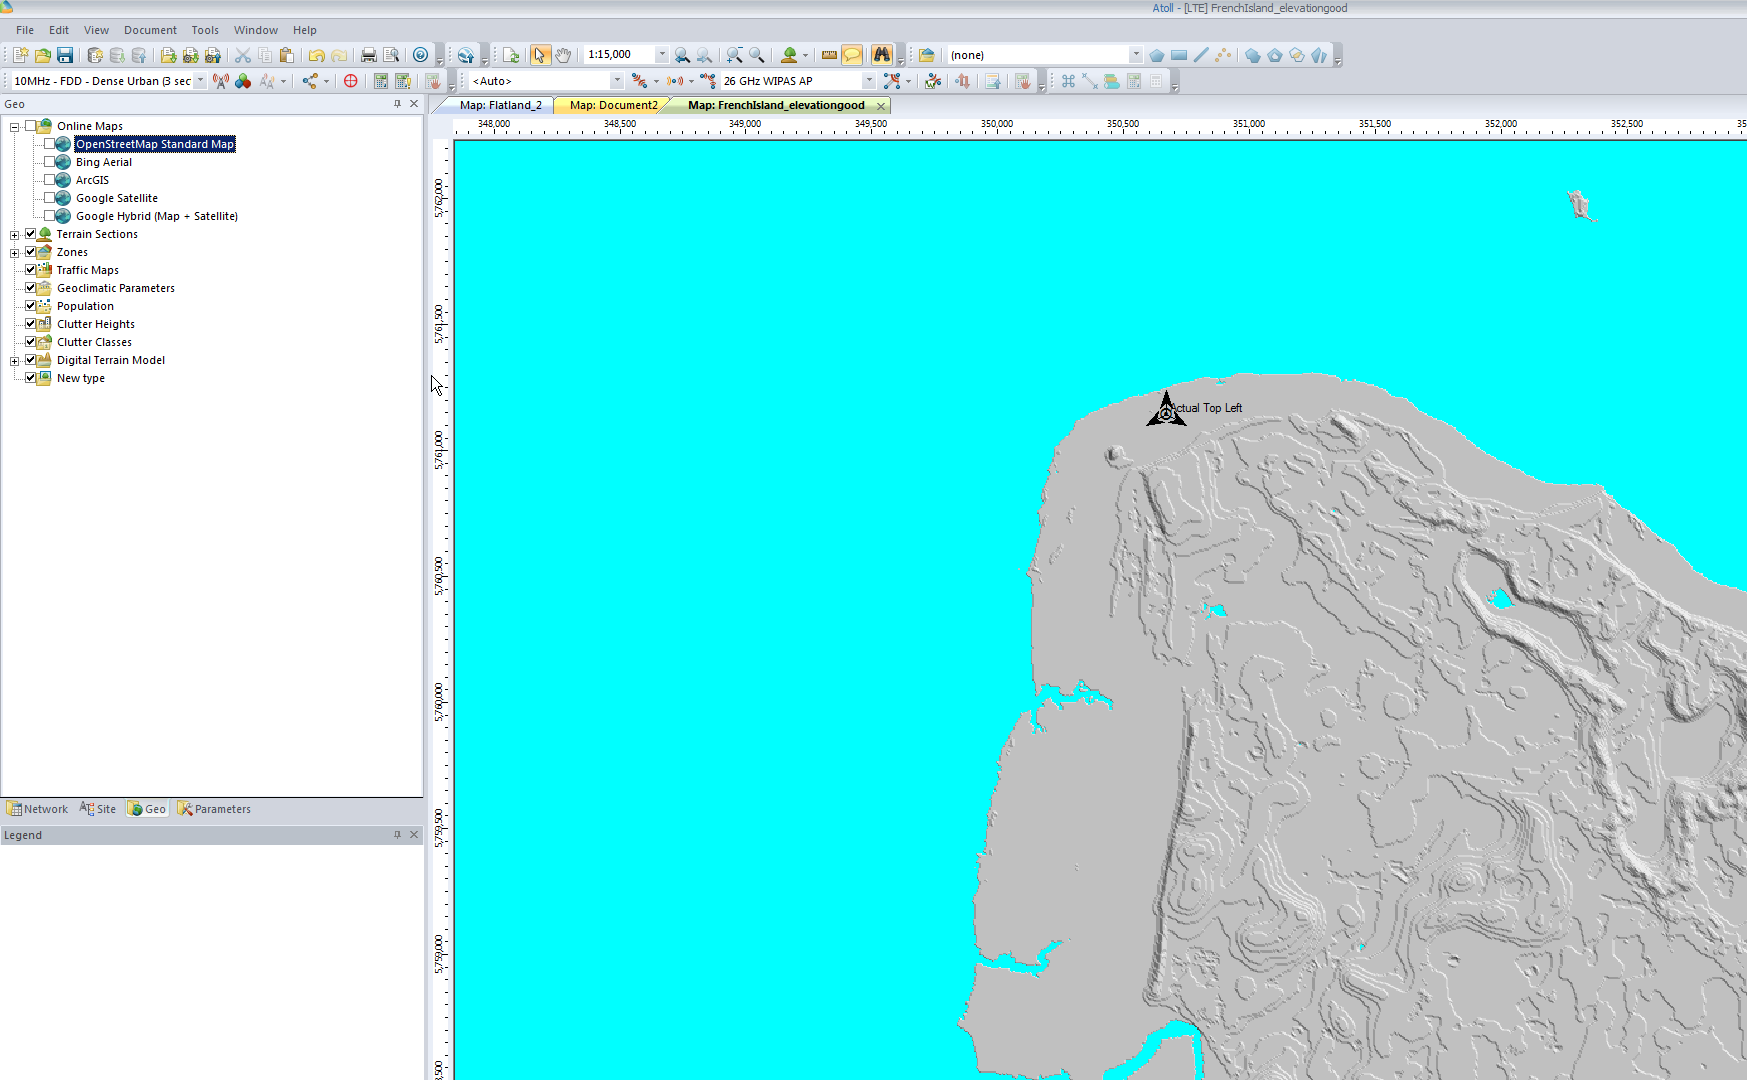
Adding a Map Overlay
Ok, you’ve made it this far, let’s finally get out of our white blank map and give it some things that make it look like a map!
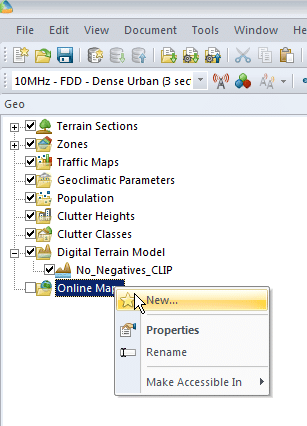
In order to add Google Maps / Bing Maps etc as an overlay for the first time, we’ve got to restart Atoll, be sure to save your work first.
Done that? Good, let’s add some map tiles.
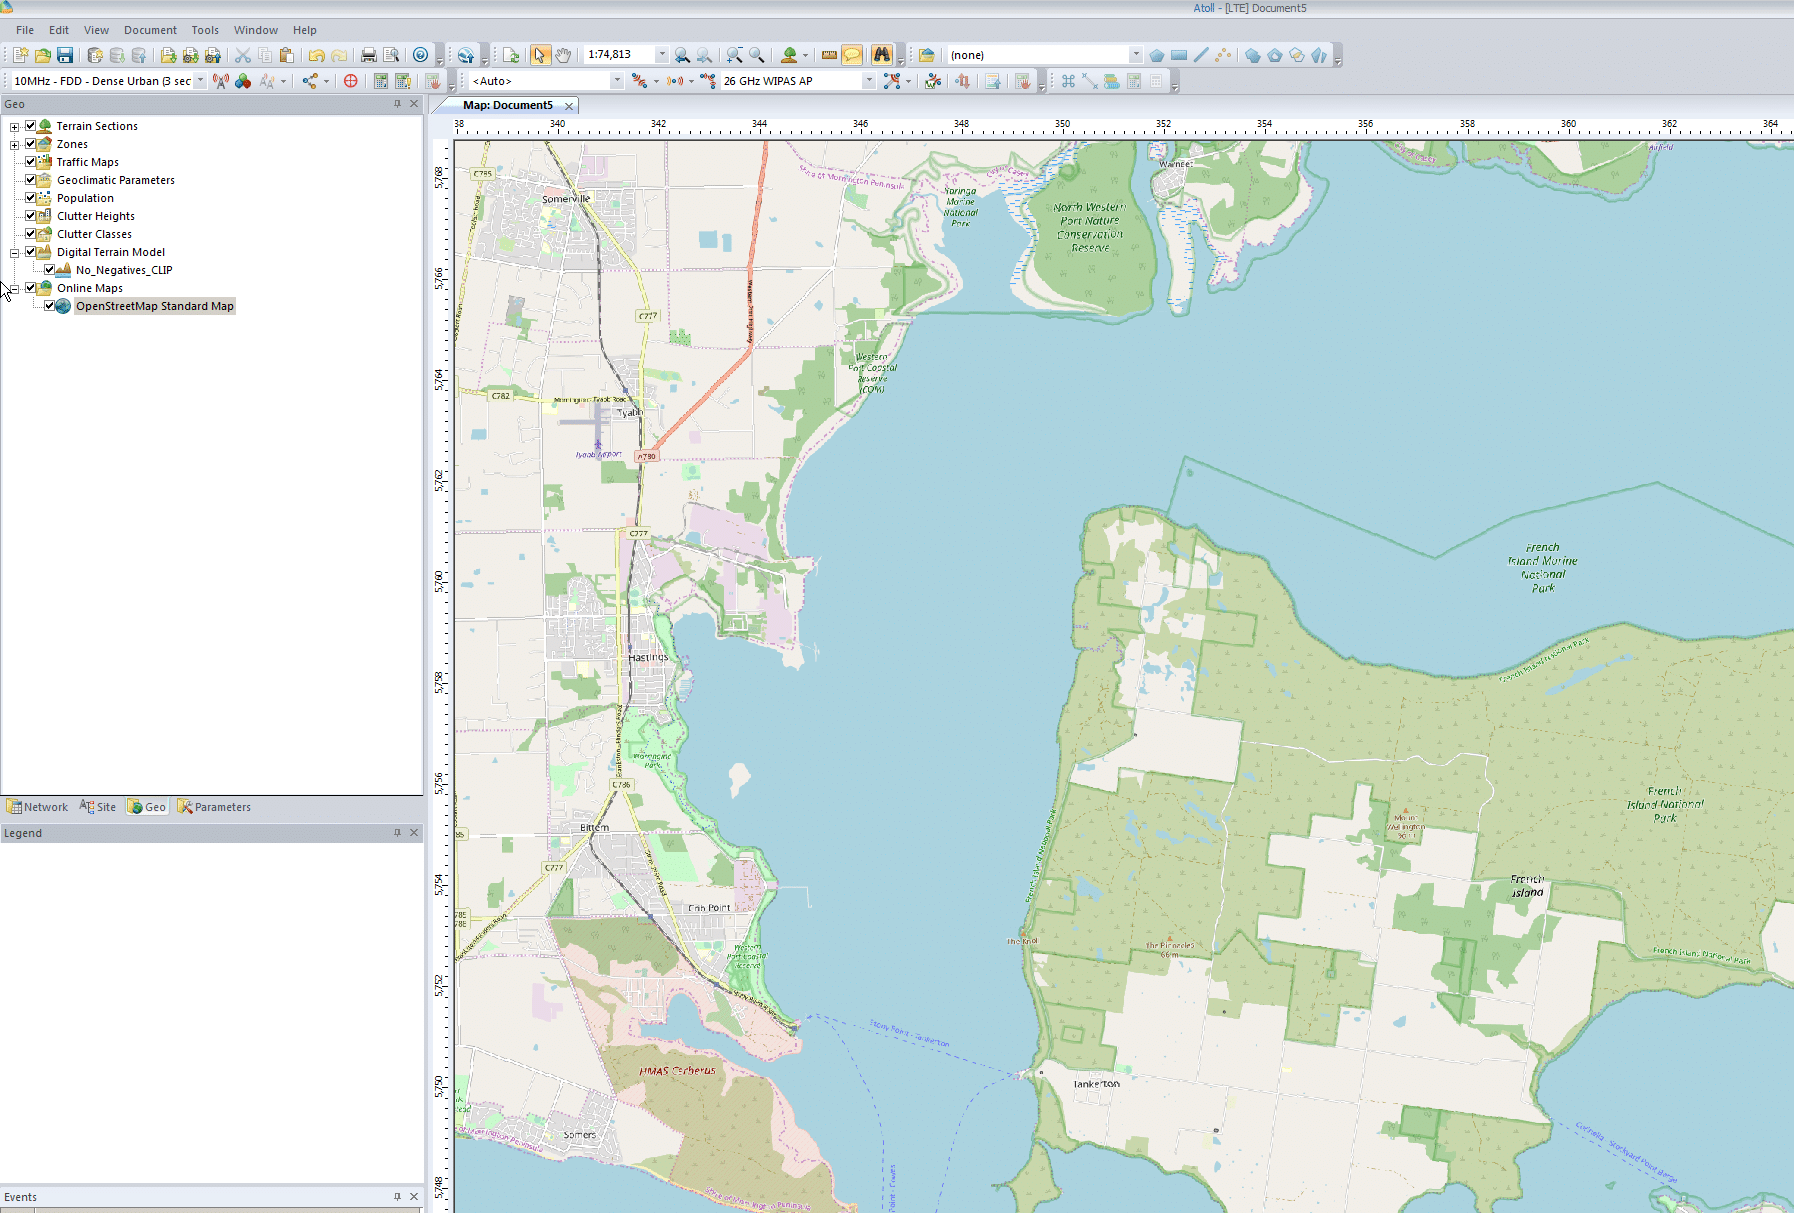
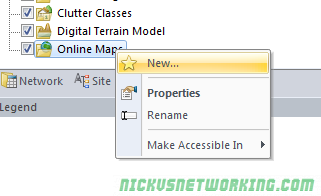
We’ll right click on Online Maps -> New and select a map source from the drop down menu,
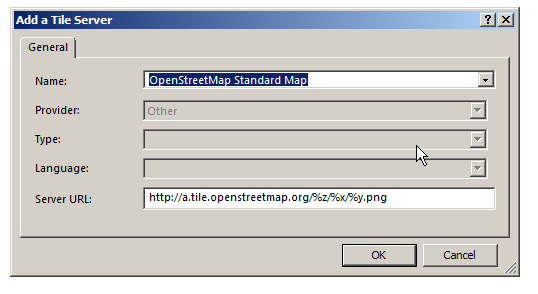
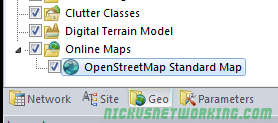
Next we’ll select a tile server, I’m using Open Street Map Standard Map, which I selected from the drop down menu,
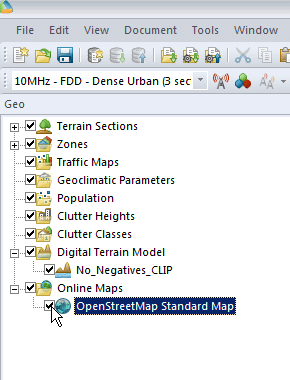
Finally we’ll enable the layer by ticking it on the Geo panel on the right hand side. You may need to drag the layer to the top if you’ve added other layers.
All going well you’ll be looking at a map of the area, and by hovering over an area of land you should see the elevation data too.
We can even add other map layers and toggle between them or set the order by dragging them up and down.
Summary
So now we’ve got Atoll configured for our part of the world, imported height data, population data and roads, and added some map layers so we can see what we’re up to.
An important point to keep in mind is the more accurate the data you feed into Atoll, the more real-world the results you’ll get out of it will be.
Although filling in map layers and adding information seems tedious – and it is – the data-in data-out approach applies here, so the more quality data we put in the better.
If you’re doing this yourself in the real world contact your Government, they often publish large amounts of geospatial data like elevation, population, roads, land boundaries, and it’s often free.
I’ve attached my working file for you to play with in case you had any issues.
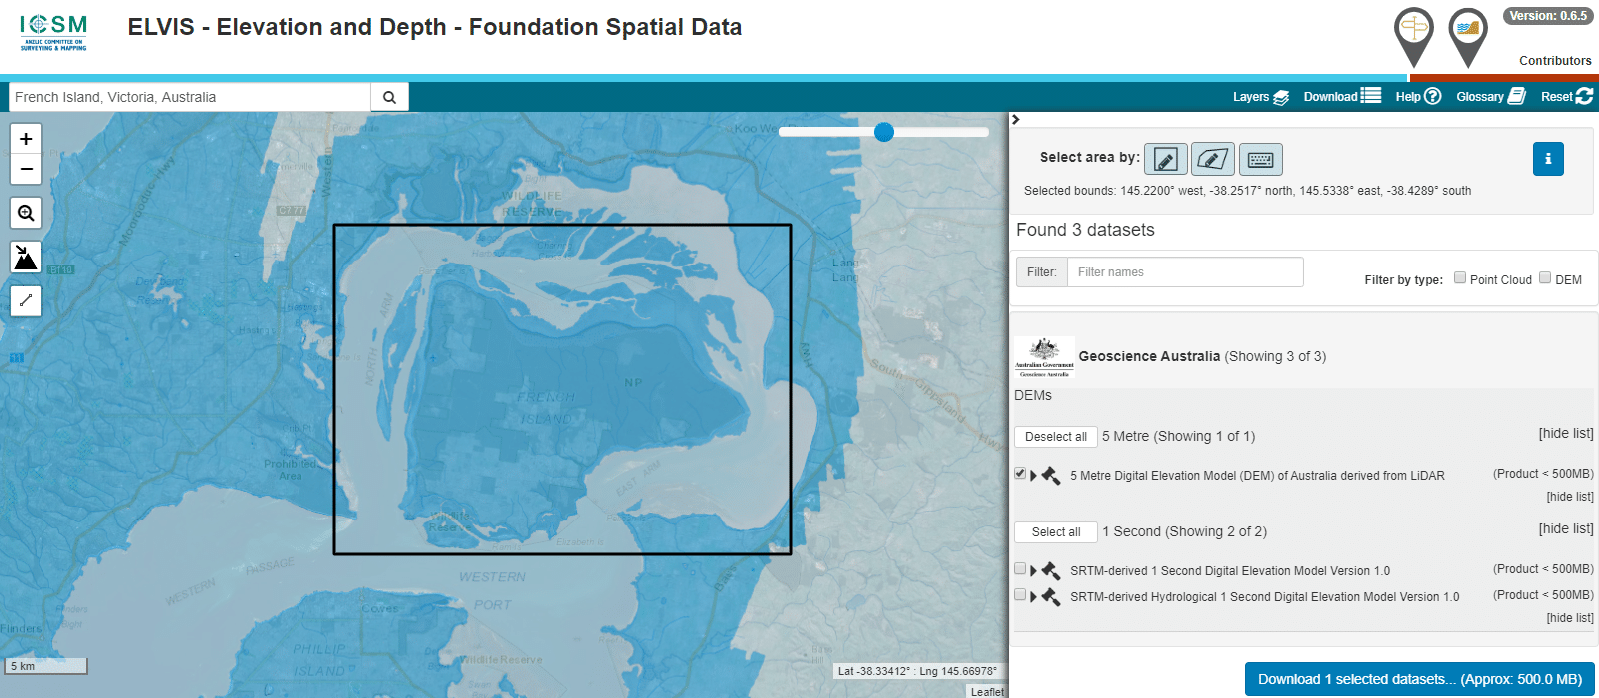
The Australian Government publishes elevation data online that’s freely available for anyone to use. There’s a catch – If you’re using Forsk Atoll, it won’t import without a fair bit of monkeying around with the data…
You draw around the area you want to download, enter your email address and you’re linked to a download of the dataset you’ve selected.
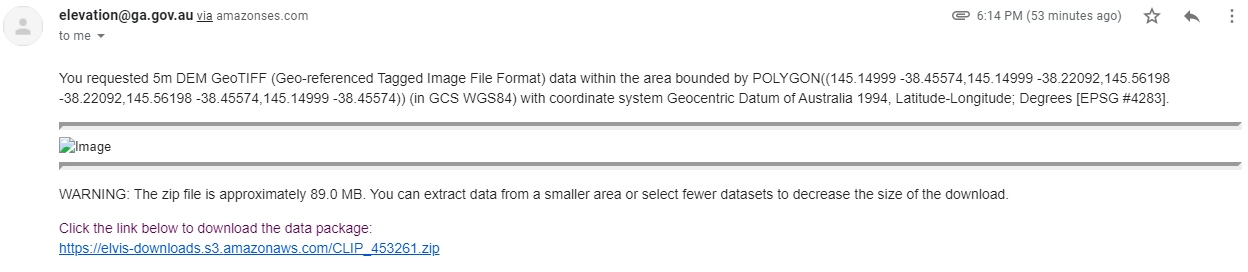
So now we download the data from the link, unzip it and we’re provided with a .tiff image with the elevation data in the pixel colour and geocoded with the positional information.
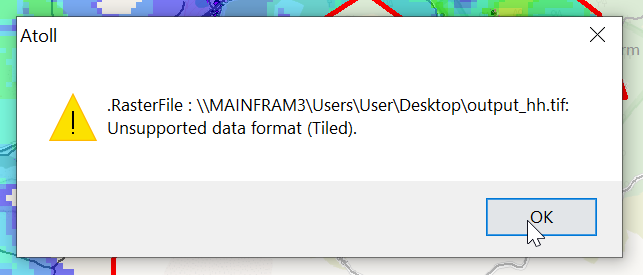
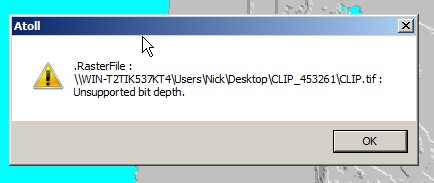
Problem is, this won’t import into Atoll – Unsupported depth.
I fired it up, and imported the elevation tiff file we’d downloaded.
Selected “Elevation” waited a few seconds and presto!
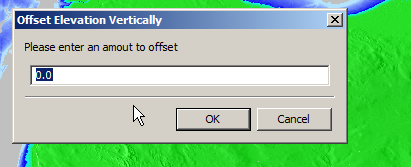
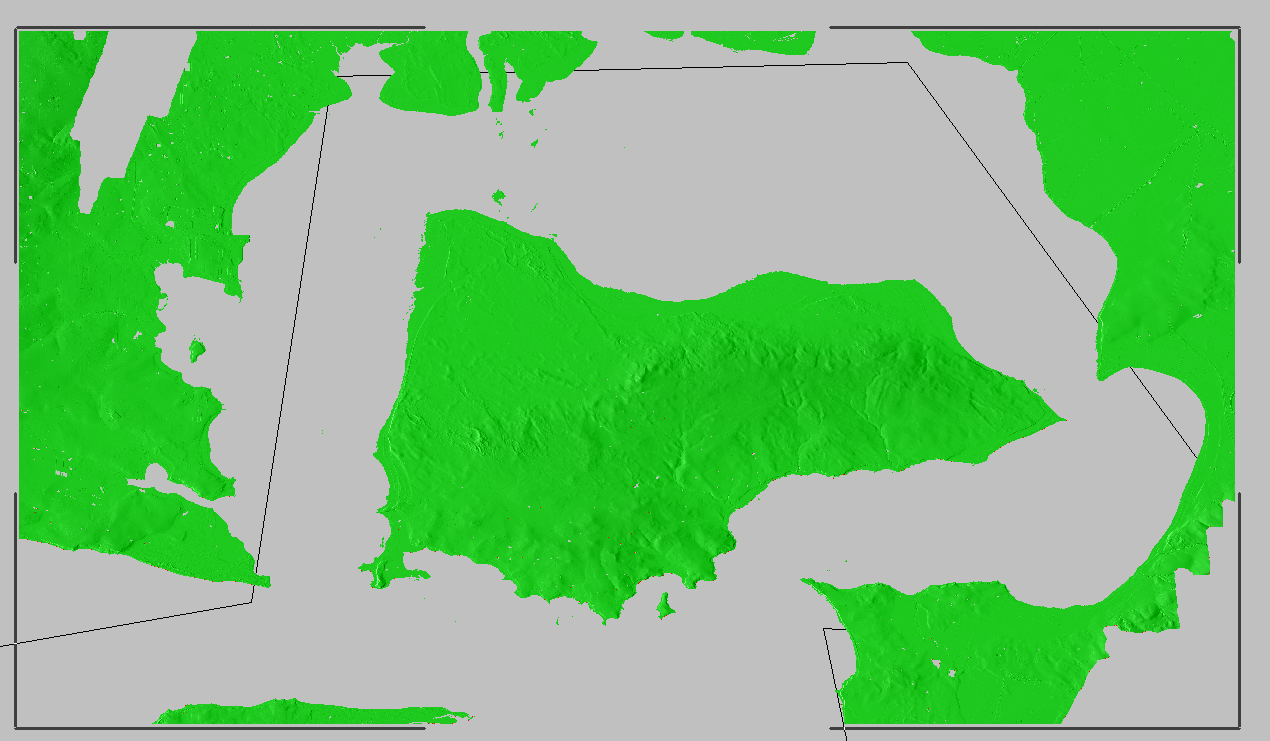
We can export from here in the PNG 16 bit grayscale format Atoll takes, but there’s a catch, negative elevation values and blank data will show up as giant spikes which will totally mess with your propagation modeling.
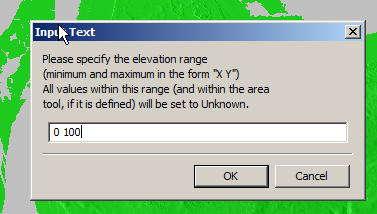
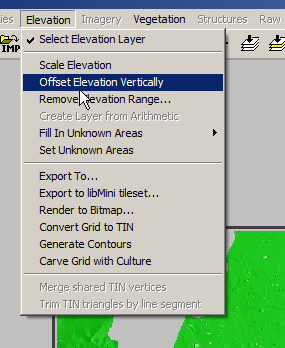
So I found an option to remove elevation data from a set range, but it won’t deal with negative values…
So I found another option in the elevation menu to offset elevation vertically, I added 100 ft (It’s all in ft for some reason) to everything which meant my elevation data that was previously negative was now just under 100.
So if an area was -1ft before it was now 99ft.
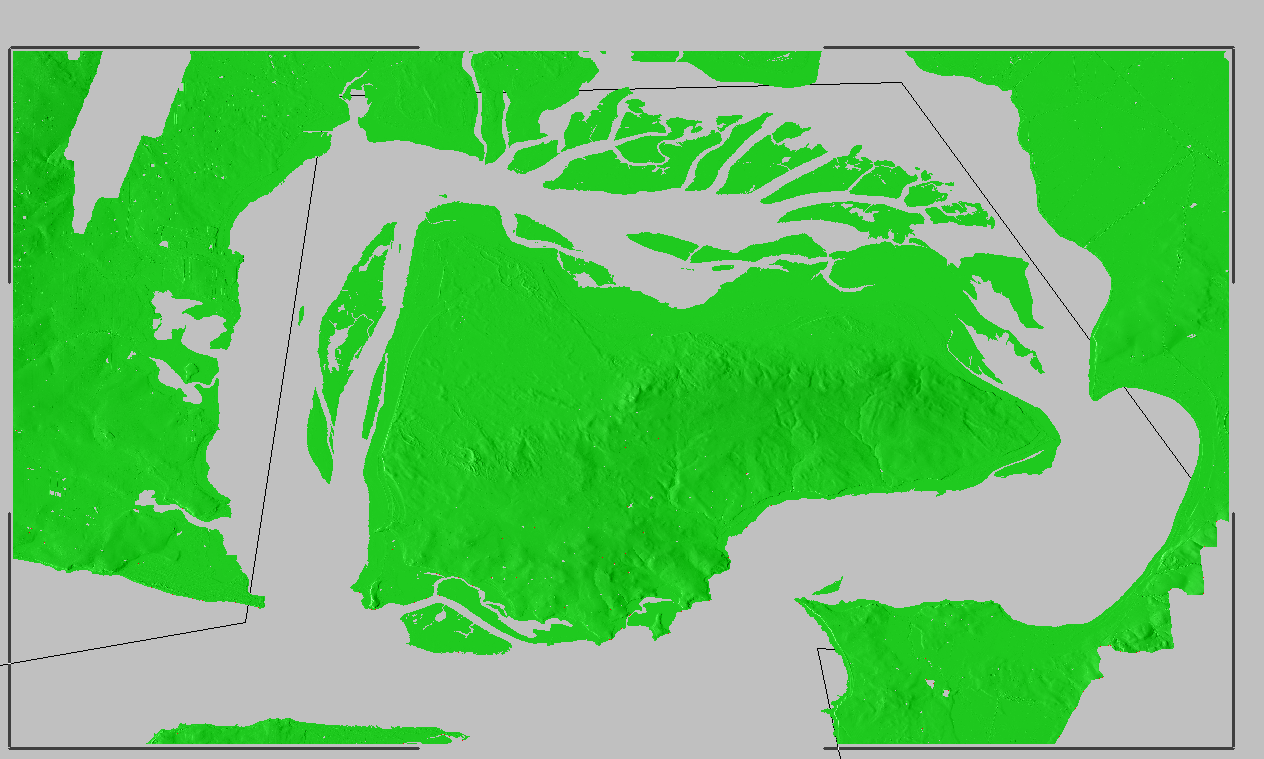
Now I was able to use the remove range for anything from 0 100 ft (previously sea level)
Now my map only shows data above sea level
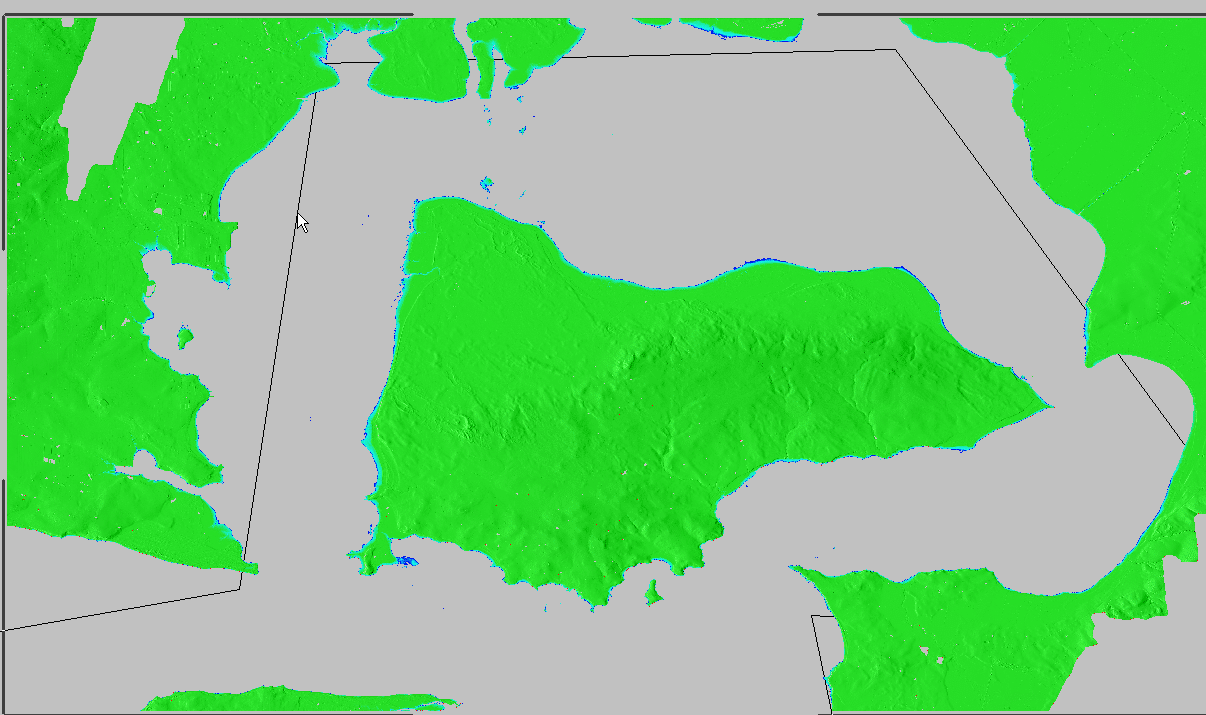
Now I offset the elevation vertically again and remove 100ft so we get back to real values
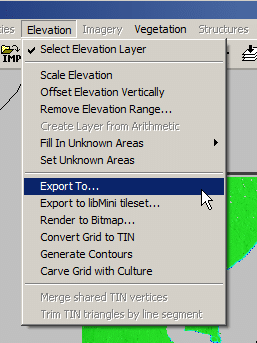
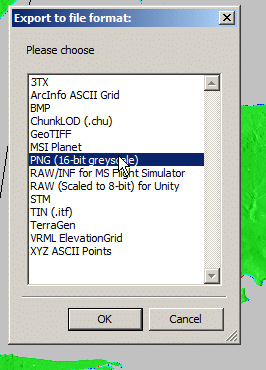
Now I was able to export the elevation data from the Elevation -> Export to menu
Atoll seems to like PNG 16 bit greyscale so that’s what we’ll feed it.
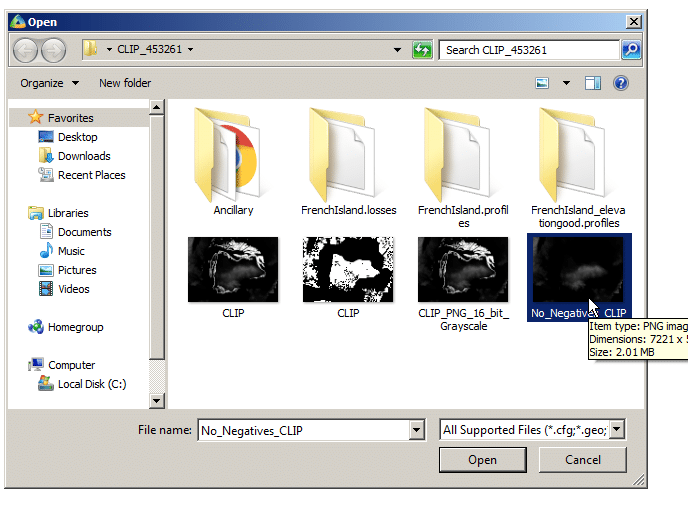
In Atoll we’ll select File -> Import and open the PNG we just generated.
Data type will be Altitude, Pixel size is 5m (as denoted in email / dataset metadata).
Next question is offset, which took me a while to work out…
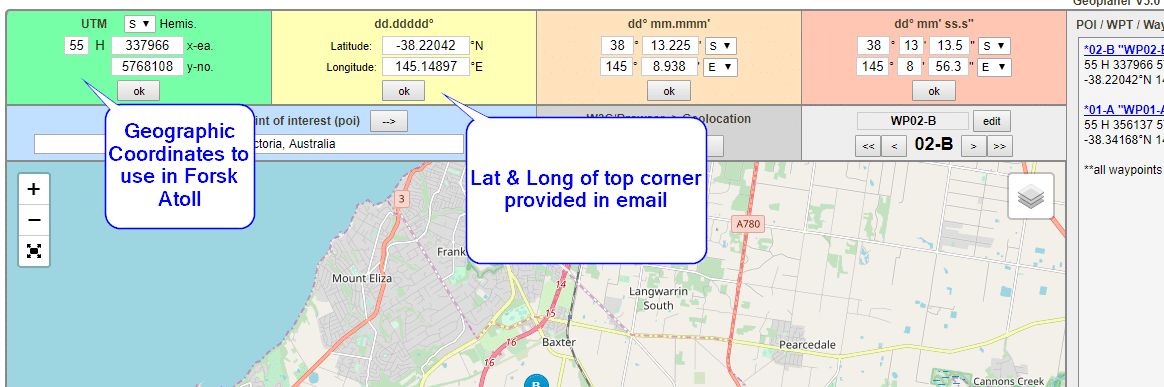
The email has the Lat & Long but Atoll deals in WGS co-ordinates,
Luckily the GeoPlanner website allows you to enter the lat & long of the top corner and get the equivalent West and North values for the UTM dataum.
Enter these values as your coordinates and you’re sorted.
I can even able a Map layer and confirm it lines up:
Forsk Atoll is software for wireless network planning, simulation and optimization.
Atoll can do some amazingly powerful things, especially when you start feeding real world data and results back into it, but for today we’ll be touching upon the basics.
As I’m learning it myself I thought I’d write up a basic tutorial on setting up the environment, importing some data, adding some sites and transmitters to your network and then simulating it.
We’ll be using Christmas Island, a small island in the Indian ocean that’s part of Australia, as it’s size makes it easy and the files small.
The Environment (Geographic Data)
The more data we can feed into Atoll the more accurate the predictions that come out of it.
Factors like terrain, obstructions, population density, land usage (residential, agricultural, etc) will all need to be modeled to produce accurate results, so getting your geographic data correct is imperative.
Starting a new Document
We’ll start by creating a new document:
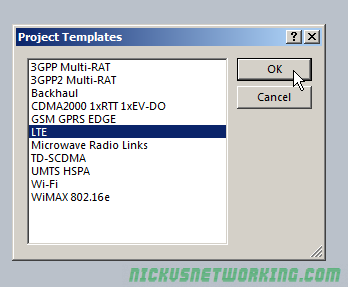
We’ll simulate an LTE network, so we’ll create it using the LTE project template.
Coordinate Reference
Before we can get to that we’re going to have to tell Atoll where we are and what datum we’re working in.
The data sets we’re working were provided by the Government, who use the Australian Geodetic Datum, and Christmas Island is in Zone 48.
We’ll select Document -> Properties
We’ll set the projection first.
Once that’s set we’ll set our display coordinates, this is what we’ll actually work in.
I’m using WGS 84 in the -xx.xxxxxx format, aka Lat & Long in decimal format.
Elevation
Elevation data is hugely important when network planning, your point-to-point links need LOS, and if your modeling / simulation doesn’t know there’s a hill or obstruction between the two sites, it’s not going to work.
There’s plenty of online sources for this data, some of which is paid, but others are provided free by Government agencies.
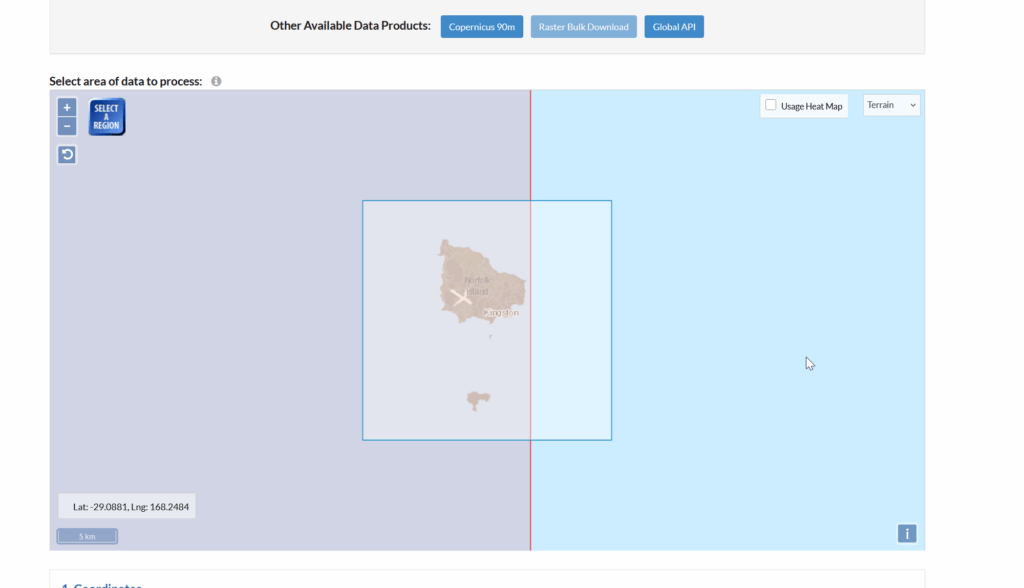
In this case the Digital Elevation Models for Christmas Island data can be downloaded from Geo-science Australia.
We’ll download the 5m DEM GDA94 UTM zone 48 Christmas Island.
The real reason I picked Christmas Island is that it’s DEM data is 16Mb instead of many Gigabytes and I didn’t want to wait for the download…
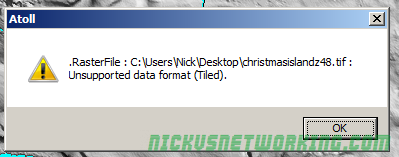
After a lot of messing around I found I couldn’t import the multi layered TIF provided by Geo Science Australia, Atoll gave me this error:
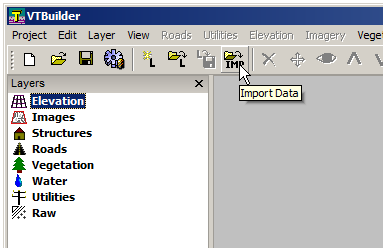
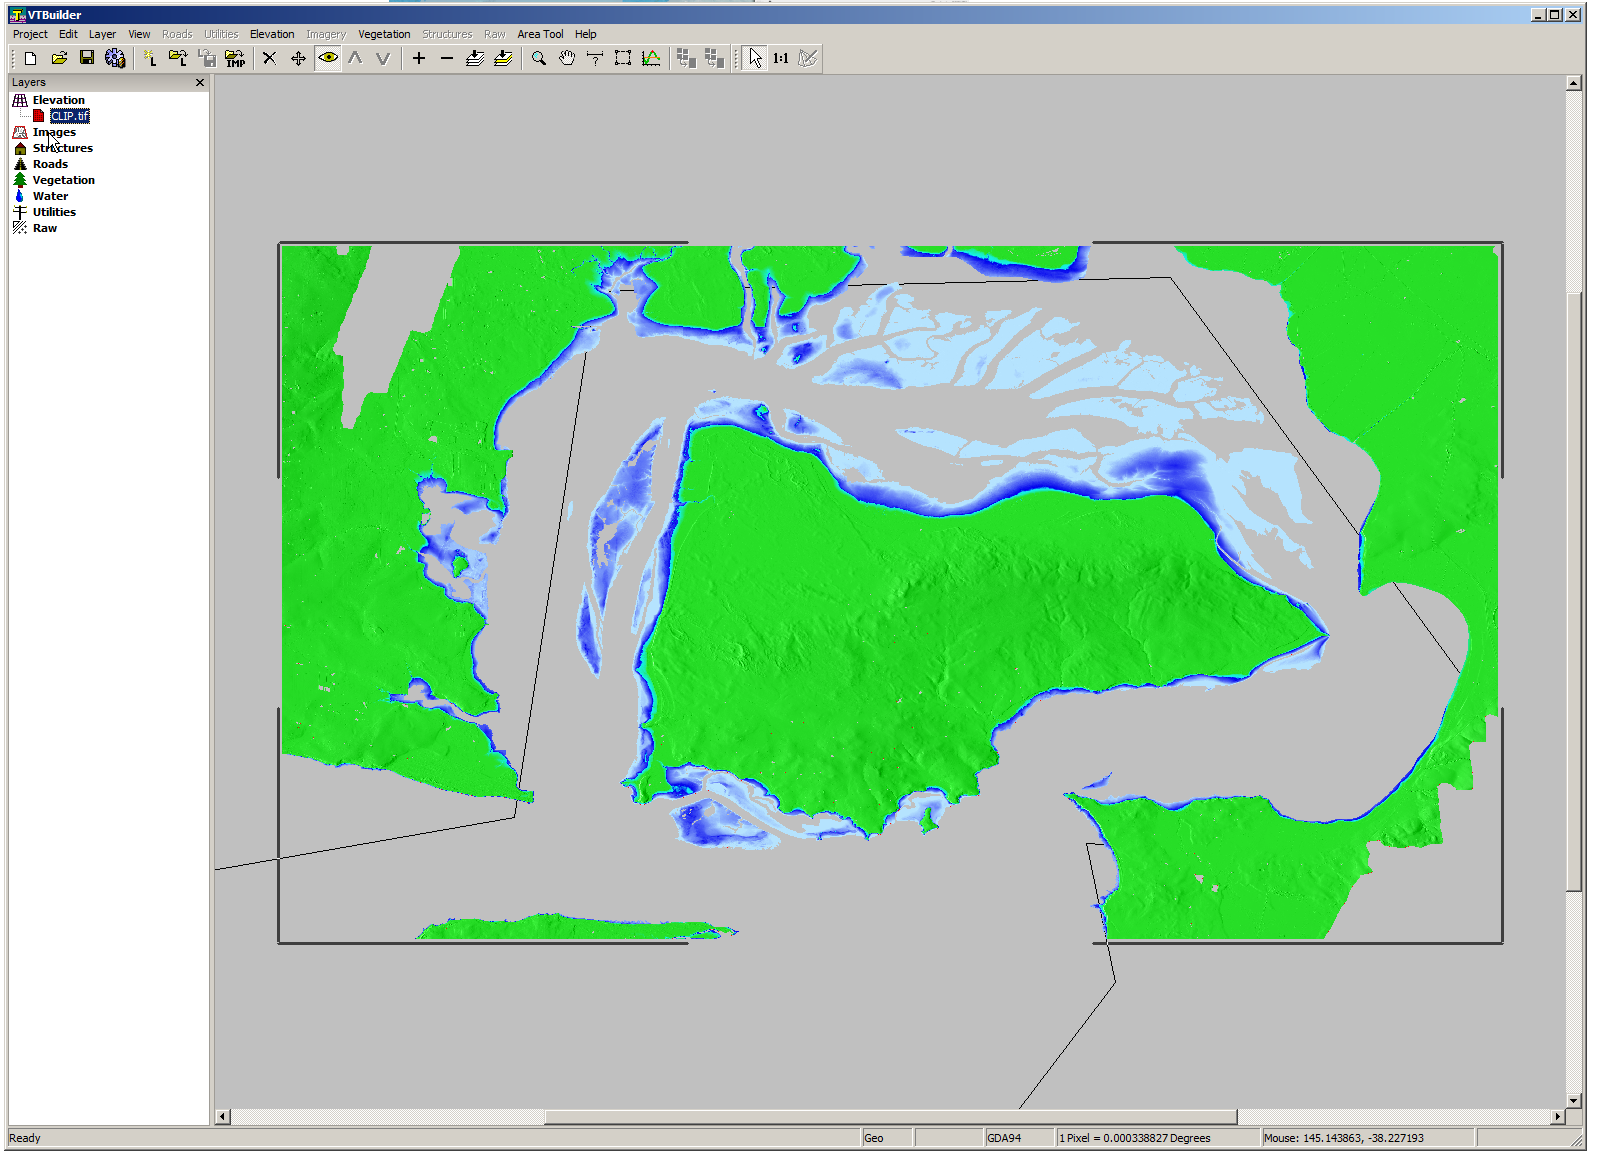
I found I could the TIFF formatted DEM files it in a package called VTBuilder, export it as a PNG and then import it into Atoll.
Using VTBuilder to convert DEMs in TIFF to PNG for importing into Atoll
To save some steps I’ve attached a copy of the converted file here.
You can then import the files straight into Atoll,
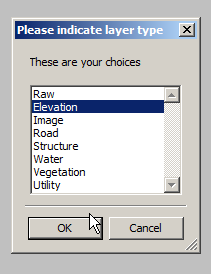
We’ll need to define what this dataset is, in our cases our Digital Elevation Models (aka Digital Terrain Models) contain Altitude information, so we’ll select Altitude (DTM)
We know from the metadata on the Geo Science Australia site we got the files from the resolution is 5m, so we’ll set pixel size to 5m (Each pixel represents 5 meters).
We’ll need a Geographic Coordinate, this is the Easting and Westing in relation to UTM Zone 48. The values are:
West
557999.9999999991
North
8849000
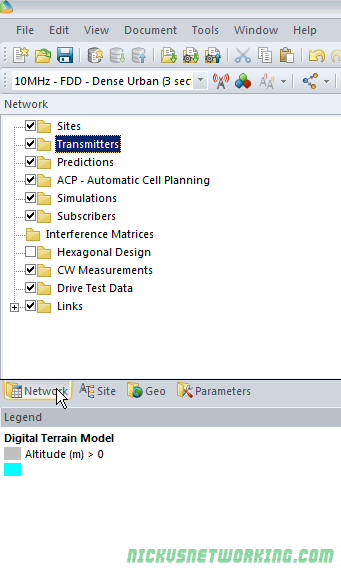
All going well you should see the imported topography showing up in Atoll.
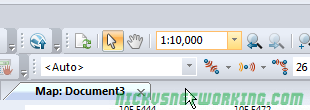
I’ve noticed on the version I’m on I had some weirdness when zoomed out, if you try Zooming in to more than 1:10,000 you should see the terrain data. Not sure why this is but I’ve attached a copy of my Atoll config so far so you in case you get stuck with this.
We’ll download real world sites from the ACMA’s database,
I’ll use the cheat way by just looking it up on their map and exporting the data.
We’ll download the CSV file from the Map.
One thing we’ll need to change in the CSV is that when no Altitude is set for the site ACMA puts “undefined” which Atoll won’t be able to parse. So I’ve just opened it up in N++ and replaced undefined with 0.
I’ve attached a copy here for you to import / skip this step. Mastering messing with CSV is a super useful skill to have anyways, but that’s a topic for another day.
Next we’ll import the sites into Atoll, to define our sites, we’ll jump to the Network Tab and double click on Sites.
Now we’ll import our CSV file
Next we’ll need to define the fields for the import
All going well you’ll now have a populated site list.
Now if we go back to view we should see these points plotted.
Clutter
Forested areas, large bodies of water, urban sprawl, farmland, etc, all have different characteristics and will cause different interference patterns, refraction, shadow fading, etc.
Clutter Data is the classification of land use or land cover which impacts on RF propagation.
However this dataset doesn’t include Christmas Island. Really shot myself in the foot there, huh?
For examples’ sake we’ll import the terrain data again as clutter.
We’d normally define terrain classes, for example, this area is residential low rise etc, but as we don’t have areas set out we’ll skip that for now.
You can set different layer visibility by enabling and disabling layers in the Geo tab, in this case I’ve disabled my Digital Terrain Model layer and just left the Clutter Heights we just imported.
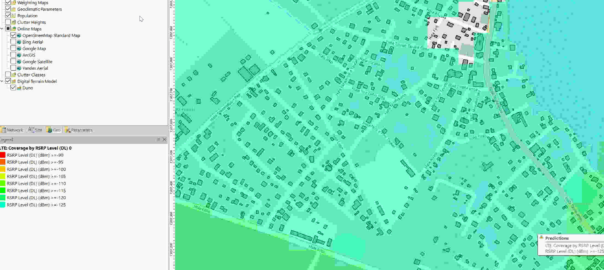
I got hit with the same Zoom bug here, not sure if it’s still loading in the background or something but the clutter data is only visible when zoomed to 1:10,000 or more, but after doing so you should see the clutter data:
So now we’ve got our environment stuff we can start to add some cell sites and model the propagation & expected signal levels throughout the island in the next post.


