Having building footprints inside Atoll is super-duper valuable, this means you can calculate your percentage of homes / buildings covered, after all geographic coverage and population coverage are two very different things.
Download the data from OSM data – If you only need a small are you can use the Export OSM page, or if you need a wider area Geofabrik provides country level exports of the data, or if you’re really keen you can download all the OSM data.
Once you’ve got the export, we’ll load the .gpkg file (or files) into GlobalMapper
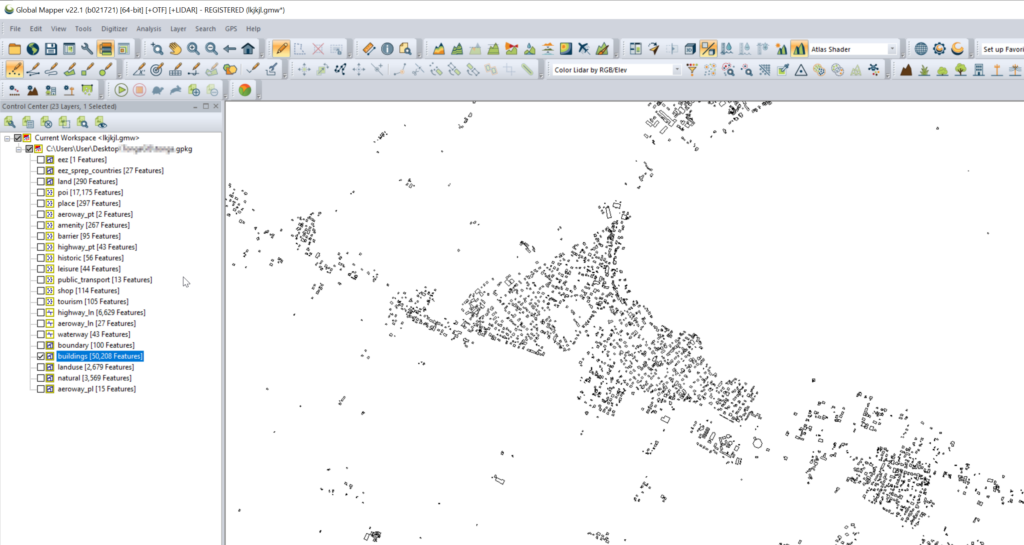
Select one layer at a time that you want to export into Atoll. (This also works for roads, geographic boundaries, POIs, etc)
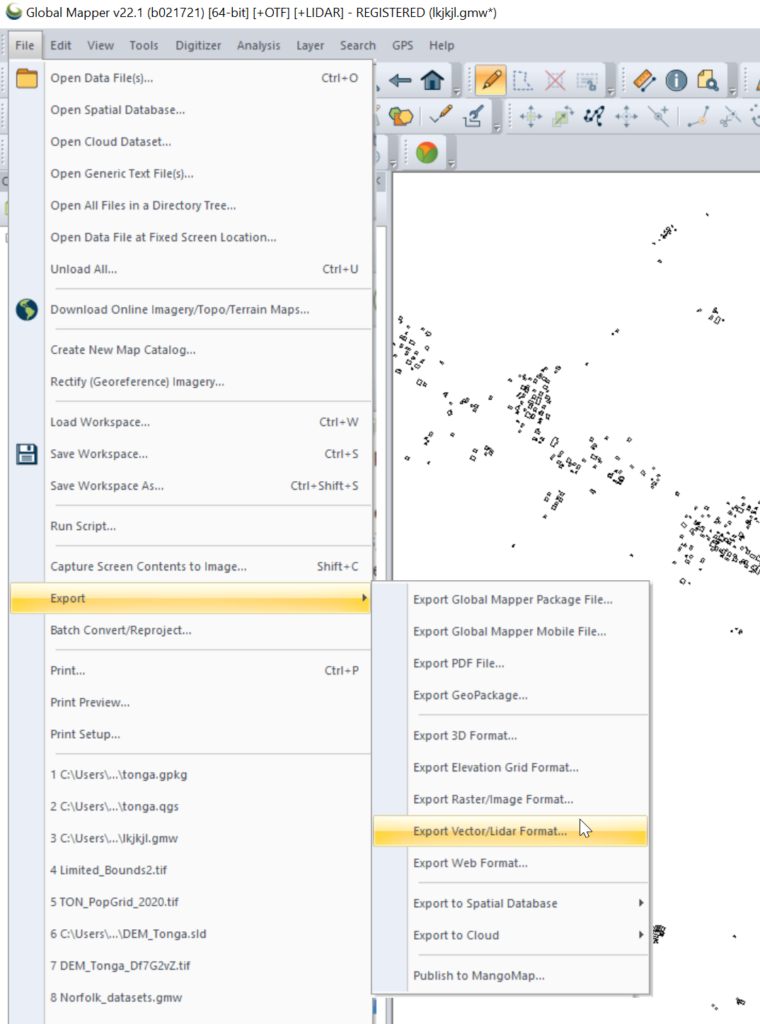
Export the selected layer from Export -> Export Vector / Lidar Format
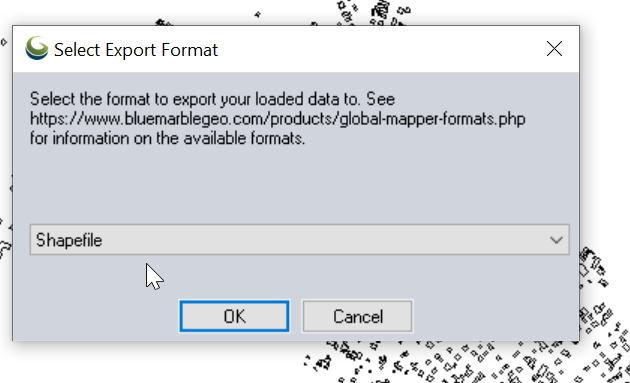
Set output type to “Shapefile”
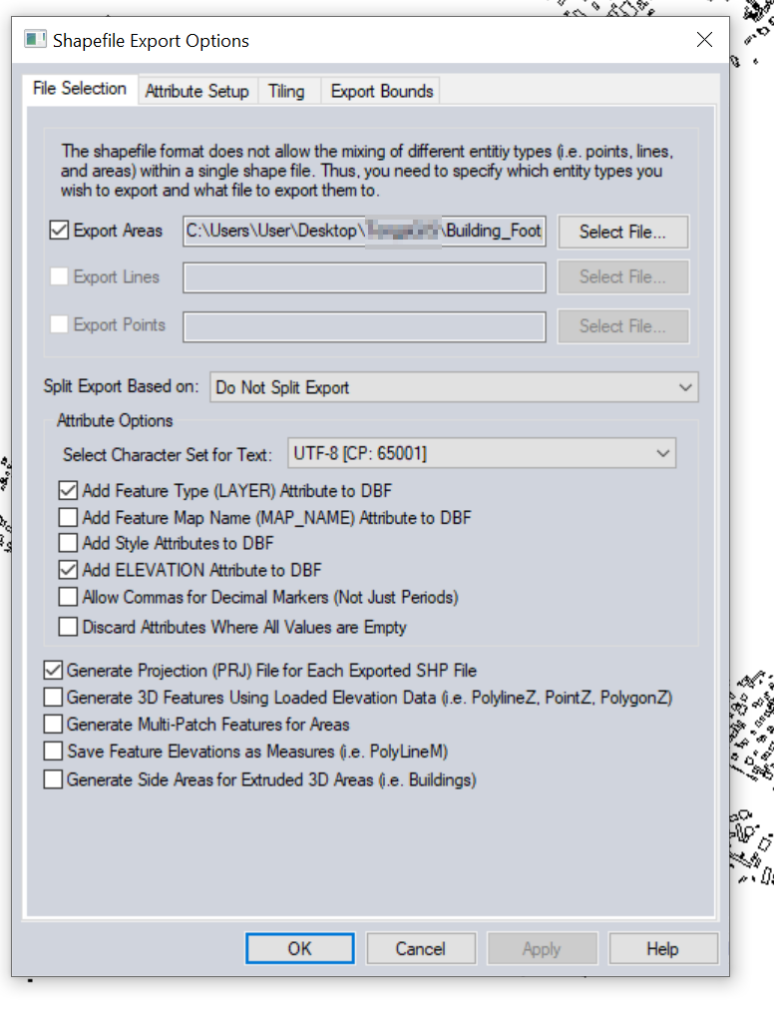
Set output filename in “Export Areas” (This will be the output file). If you want to limit the export to a given area you can do that in Export Bounds.
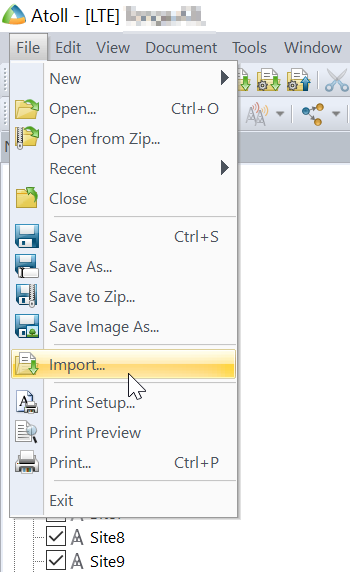
Now we can import this data into Atoll.
File -> Import
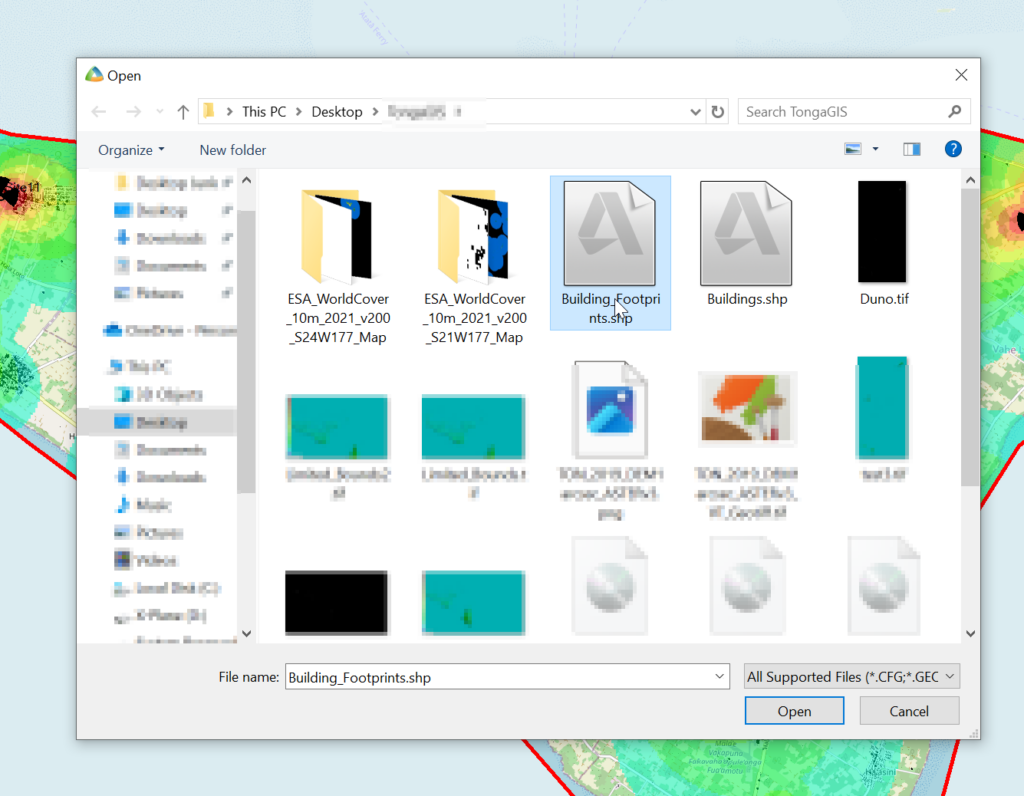
Select the exported Shapefile we just created.
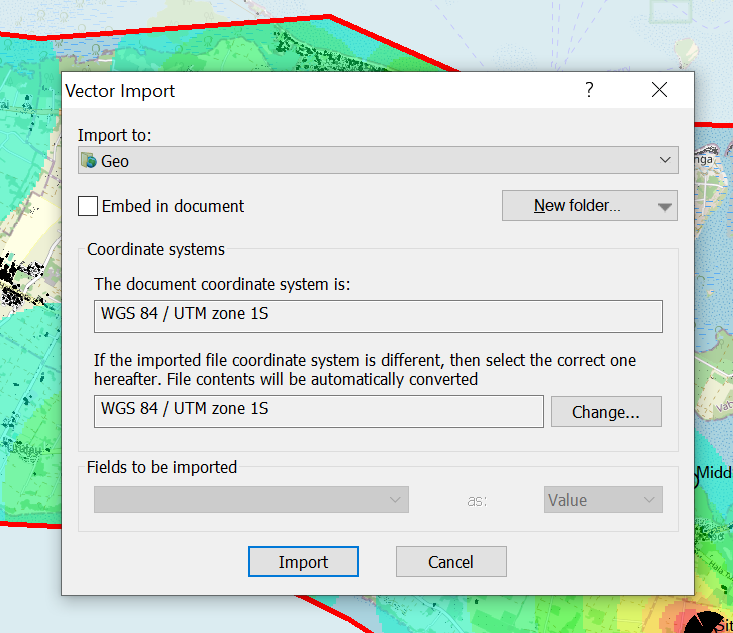
Set the projection and import
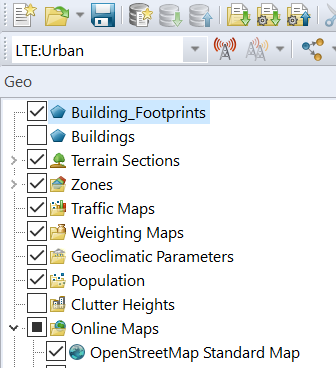
Bingo now we’ve got our building footprints,
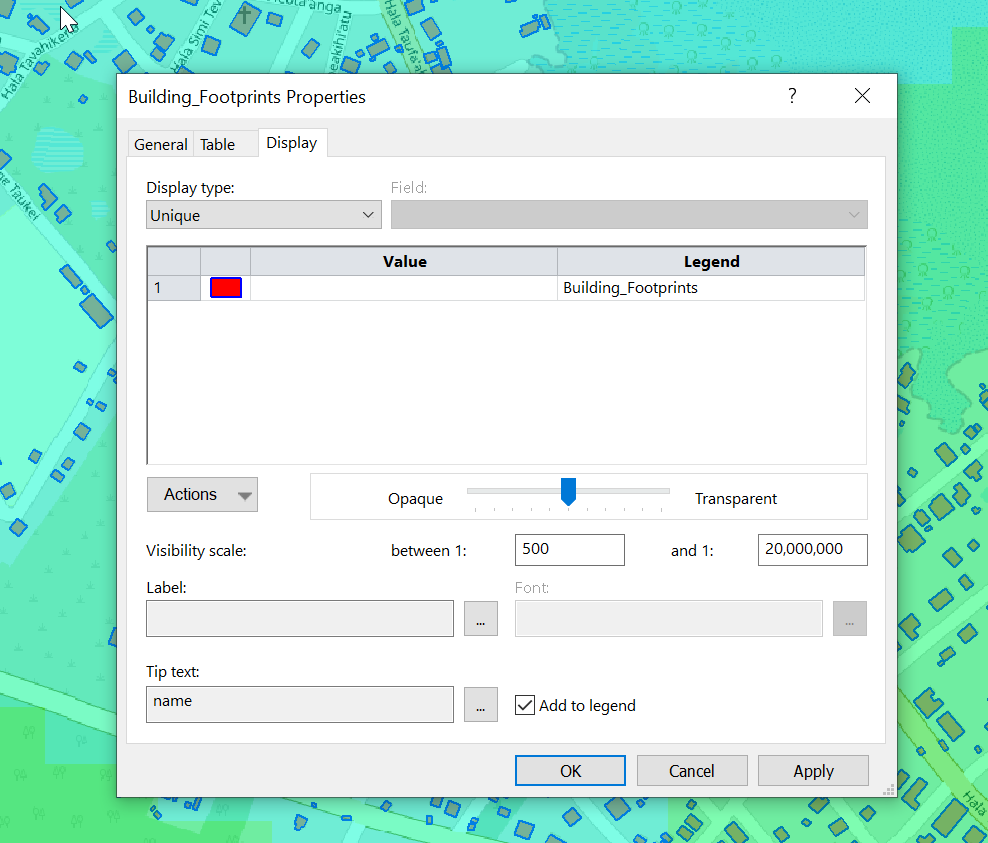
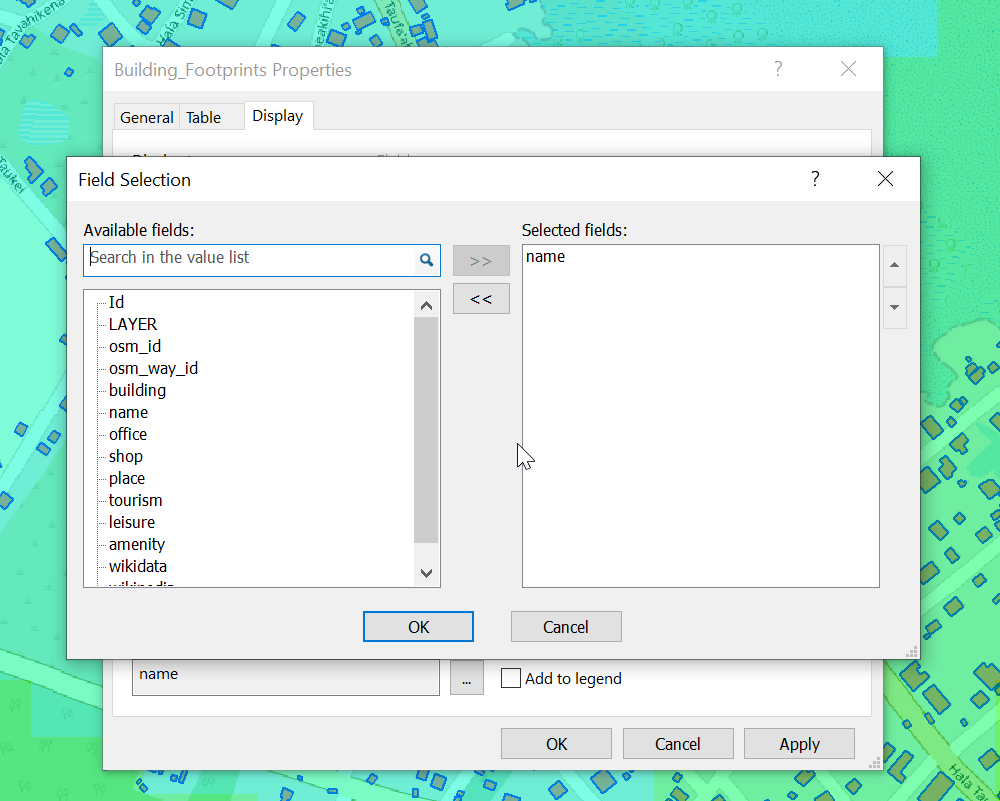
We can change the style of the layer and the labels as needed.
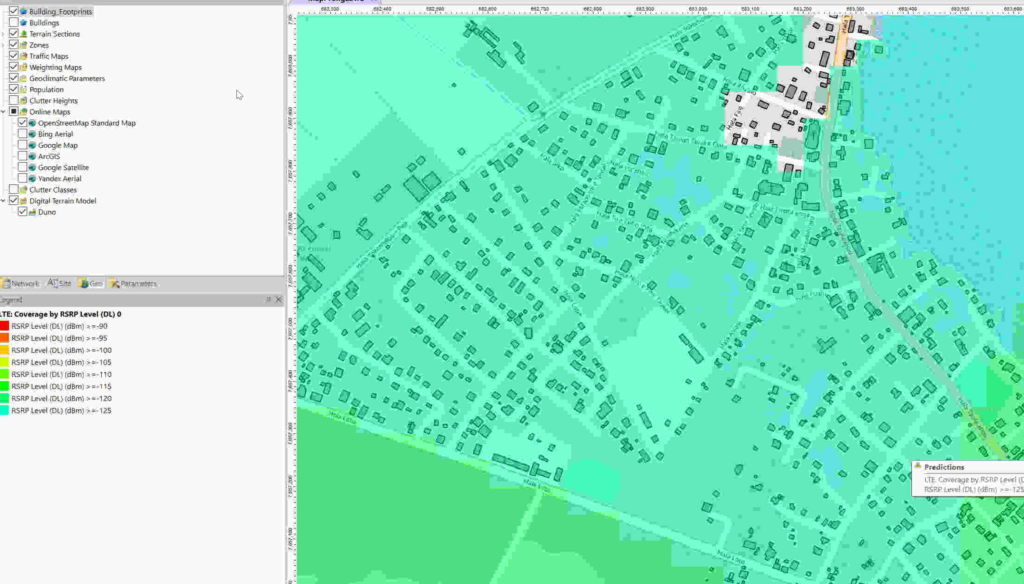
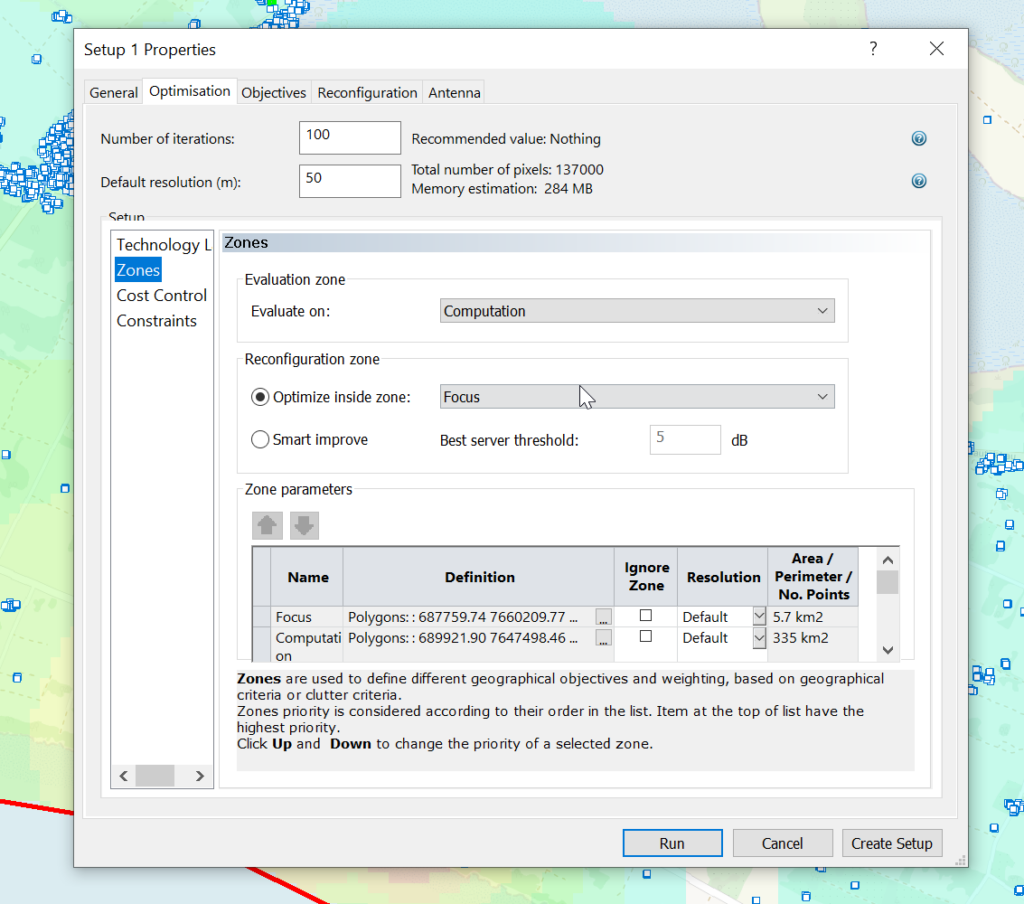
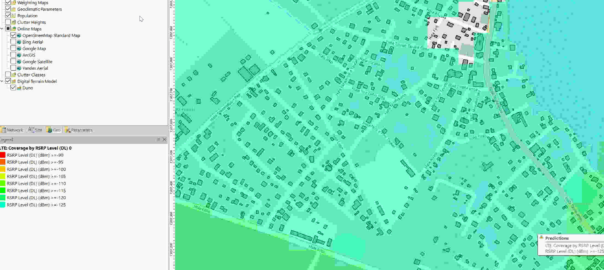
Now we can use the buildings as the Focus Zone / Compute Zone and then run reports and predictions based on those areas.
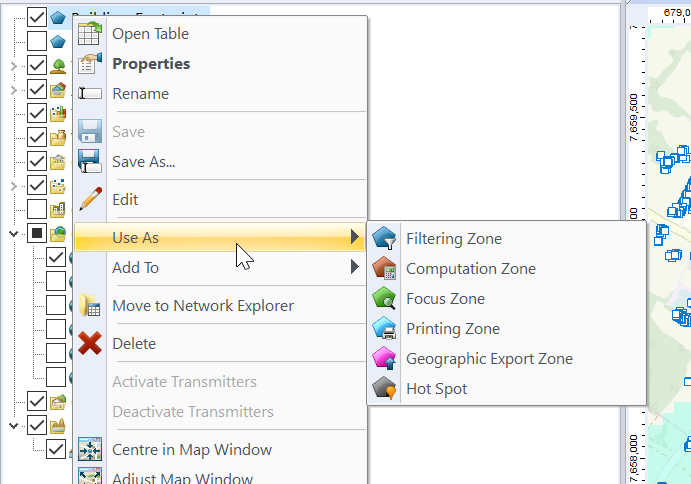
For example I can run Automatic Cell Planning with the building layers as the Focus zones, to optimize azimuths, tilts and powers to provide coverage to where people live, not just vacant land.