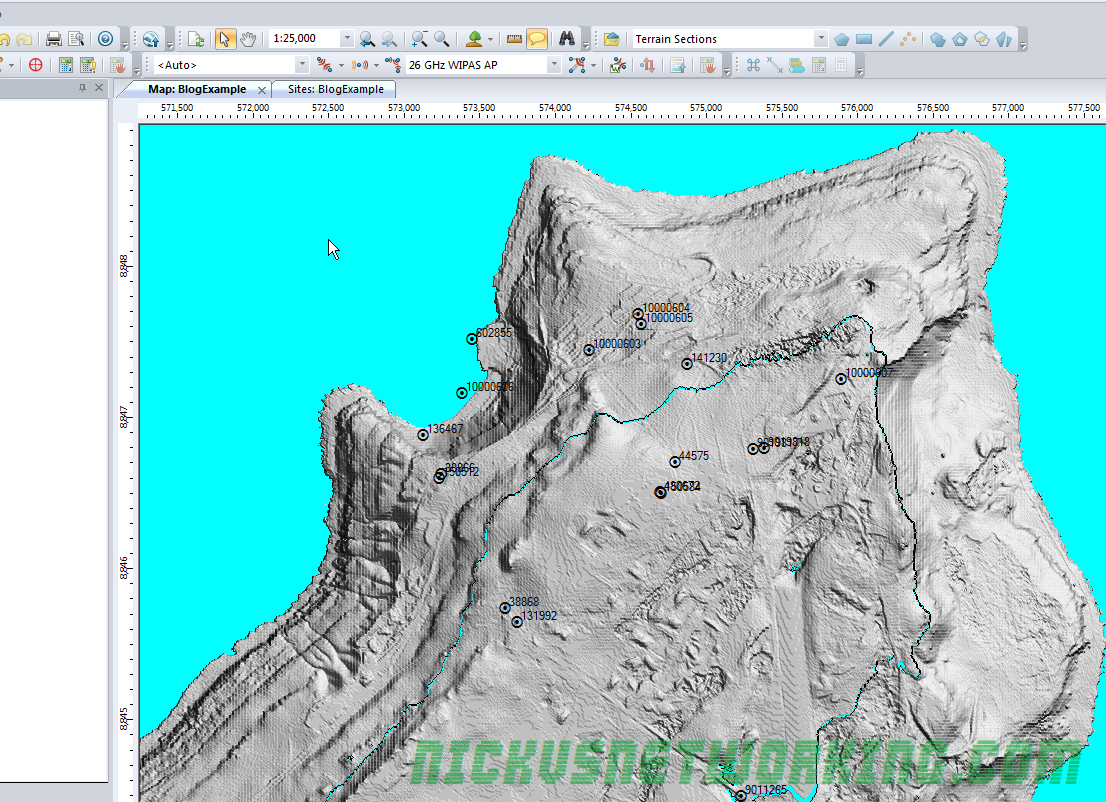
Forsk Atoll is software for wireless network planning, simulation and optimization.
Atoll can do some amazingly powerful things, especially when you start feeding real world data and results back into it, but for today we’ll be touching upon the basics.
As I’m learning it myself I thought I’d write up a basic tutorial on setting up the environment, importing some data, adding some sites and transmitters to your network and then simulating it.
We’ll be using Christmas Island, a small island in the Indian ocean that’s part of Australia, as it’s size makes it easy and the files small.
The Environment (Geographic Data)
The more data we can feed into Atoll the more accurate the predictions that come out of it.
Factors like terrain, obstructions, population density, land usage (residential, agricultural, etc) will all need to be modeled to produce accurate results, so getting your geographic data correct is imperative.
Starting a new Document
We’ll start by creating a new document:

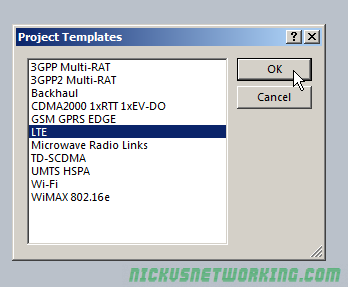
We’ll simulate an LTE network, so we’ll create it using the LTE project template.
Coordinate Reference
Before we can get to that we’re going to have to tell Atoll where we are and what datum we’re working in.
The data sets we’re working were provided by the Government, who use the Australian Geodetic Datum, and Christmas Island is in Zone 48.
We’ll select Document -> Properties

We’ll set the projection first.


Once that’s set we’ll set our display coordinates, this is what we’ll actually work in.
I’m using WGS 84 in the -xx.xxxxxx format, aka Lat & Long in decimal format.

Elevation
Elevation data is hugely important when network planning, your point-to-point links need LOS, and if your modeling / simulation doesn’t know there’s a hill or obstruction between the two sites, it’s not going to work.
There’s plenty of online sources for this data, some of which is paid, but others are provided free by Government agencies.
In this case the Digital Elevation Models for Christmas Island data can be downloaded from Geo-science Australia.
We’ll download the 5m DEM GDA94 UTM zone 48 Christmas Island.
The real reason I picked Christmas Island is that it’s DEM data is 16Mb instead of many Gigabytes and I didn’t want to wait for the download…
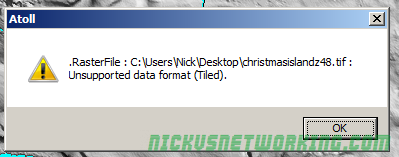
After a lot of messing around I found I couldn’t import the multi layered TIF provided by Geo Science Australia, Atoll gave me this error:
I found I could the TIFF formatted DEM files it in a package called VTBuilder, export it as a PNG and then import it into Atoll.

To save some steps I’ve attached a copy of the converted file here.
You can then import the files straight into Atoll,

We’ll need to define what this dataset is, in our cases our Digital Elevation Models (aka Digital Terrain Models) contain Altitude information, so we’ll select Altitude (DTM)
We know from the metadata on the Geo Science Australia site we got the files from the resolution is 5m, so we’ll set pixel size to 5m (Each pixel represents 5 meters).
We’ll need a Geographic Coordinate, this is the Easting and Westing in relation to UTM Zone 48. The values are:
| West | 557999.9999999991 |
| North | 8849000 |

All going well you should see the imported topography showing up in Atoll.

I’ve noticed on the version I’m on I had some weirdness when zoomed out, if you try Zooming in to more than 1:10,000 you should see the terrain data. Not sure why this is but I’ve attached a copy of my Atoll config so far so you in case you get stuck with this.
Comms Sites
We’ll download real world sites from the ACMA’s database,
I’ll use the cheat way by just looking it up on their map and exporting the data.

We’ll download the CSV file from the Map.
One thing we’ll need to change in the CSV is that when no Altitude is set for the site ACMA puts “undefined” which Atoll won’t be able to parse. So I’ve just opened it up in N++ and replaced undefined with 0.

I’ve attached a copy here for you to import / skip this step. Mastering messing with CSV is a super useful skill to have anyways, but that’s a topic for another day.
Next we’ll import the sites into Atoll, to define our sites, we’ll jump to the Network Tab and double click on Sites.
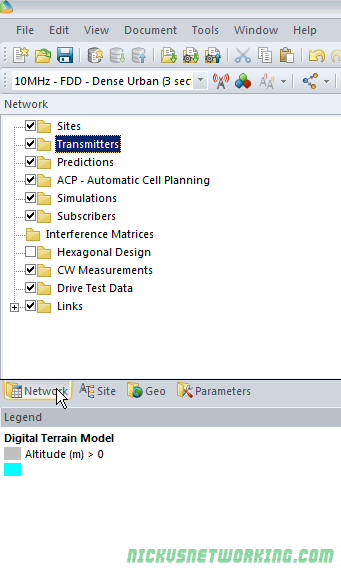
Now we’ll import our CSV file


Next we’ll need to define the fields for the import

All going well you’ll now have a populated site list.

Now if we go back to view we should see these points plotted.

Clutter
Forested areas, large bodies of water, urban sprawl, farmland, etc, all have different characteristics and will cause different interference patterns, refraction, shadow fading, etc.
Clutter Data is the classification of land use or land cover which impacts on RF propagation.
There’s several online sources of Clutter data, including the Australian Government Land Use data.
However this dataset doesn’t include Christmas Island. Really shot myself in the foot there, huh?
For examples’ sake we’ll import the terrain data again as clutter.

We’d normally define terrain classes, for example, this area is residential low rise etc, but as we don’t have areas set out we’ll skip that for now.
You can set different layer visibility by enabling and disabling layers in the Geo tab, in this case I’ve disabled my Digital Terrain Model layer and just left the Clutter Heights we just imported.
I got hit with the same Zoom bug here, not sure if it’s still loading in the background or something but the clutter data is only visible when zoomed to 1:10,000 or more, but after doing so you should see the clutter data:

So now we’ve got our environment stuff we can start to add some cell sites and model the propagation & expected signal levels throughout the island in the next post.
